

Key highlights:
- Learn how to identify inefficiencies and streamline operations by mapping your processes
- Explore the differences between the most common process maps, including flowcharts, swimlane diagrams, and value stream maps
- Understand the language of business process maps, including common process map symbols and terminology
- Learn best practices and strategies for process mapping at your business
What is business process mapping?
Business process mapping is the act of visualizing how your team or company works using techniques like flowcharts, diagrams, or Gantt charts. It’s a way to bring definition and clarity to your workflow, so you can analyze your processes and procedures and identify bottlenecks or areas for process improvement. Process maps create a detailed picture of how tasks flow from start to finish, identifying roles, responsibilities, decision points, and information pathways along the way.
The real power of a business process map is in showing how different activities and departments interact, revealing the hidden relationships that impact the everyday functioning of your business. By mapping the process out on paper (or, more likely, in a visual collaboration platform like Mural) you can turn abstract concepts into a tangible, clarifying portrait of how all the parts of your business work together to analyze and optimize your workflows. And the results are clear — according to Forrester, business processes mapping projects typically deliver 15-30% productivity gains for knowledge workers and an incredible 30-50% gains for back office and clerical staff.
The history of process maps in businesses
The roots of process mapping go back to 1921, when engineer, consultant, author, and all-around Renaissance man Frank Bunker Gilbreth gave a presentation to the American Society of Mechanical Engineers about a management tool he called “a process chart.” Gilbreth believed the secret to efficiency lay in breaking processes down into the smallest number of motions to eliminate unnecessary steps, enabling workers to move faster and increase productivity. ASME began championing Gilbreth’s techniques, and in the following decades, they developed standardized process map symbols to help the technique become a foundational tool in operations and management.
In the 1950s, industrial engineers at General Electric developed the flowchart, which quickly became the standard diagram for documenting processes. The 1980s brought Total Quality Management (TQM) and Six Sigma methodologies, which made business process mapping a fundamental part of regular improvement efforts. Today, process mapping has evolved from a specialized engineering technique to an essential business practice that teams across the org regularly participate in and refine using process mapping tools and software.
Just starting to map your business processes for the first time? Use the Business model canvas workshop template to get a better understanding of what your business needs to succeed.
Why build business process maps?
Organizations create a process map to establish visual clarity in complex operations. When processes exist only in employees' minds or in scattered documentation, it’s easy for workflows to become overly convoluted or full of redundancies. Business process maps are useful for:
- Standardizing operations across departments, locations, and shifts
- Onboarding employees with clear visual training materials
- Meeting compliance requirements with documented procedures
- Identifying bottlenecks that impact productivity and customer satisfaction
- Facilitating change management by clarifying current and future states
- Preserving institutional knowledge beyond individual employees
Process maps can be especially useful during digital transformation initiatives, helping business planners decide what can be automated, how systems should integrate, and which tasks require a human touch.
Process maps are great for helping you understand your customers’ needs and expectations. In fact, 76% of companies said that customer journey map data increased their investment ROI.
Benefits of business process mapping
The business mapping process can help teams and organizations:
- Enhance efficiency by identifying redundant steps, unnecessary approvals, and wasted effort.
- Improve quality of products and solutions by shining a light on areas where errors occur and where preventive messages should be implemented.
- Align cross-functionally by revealing where departments are interdependent to help break down silos and improve collaboration, leading to smoother handoffs and fewer miscommunications.
- Manage risk by identifying potential failure points and compliance issues before they become problems.
- Make more data-driven decisions by identifying key areas where performance metrics could be collected to enable fact-based improvement decisions.
- Catalyze innovation by providing a holistic view of operations, sparking ideas for improvements that might go unnoticed otherwise.
Types of process maps to use in your business
Flowcharts provide a straightforward visualization of process steps using standardized process map symbols for activities, decisions, and documents. They're ideal for relatively simple processes with clear start and end points.
Swimlane diagrams organize activities into parallel lanes representing different departments or roles. Swimlane diagrams are particularly valuable for mapping cross-functional processes.
Value stream maps focus on eliminating waste by distinguishing activities that add value from non-value-adding activities. They include metrics like process time and wait time, making them helpful in understanding how time impacts profits.
SIPOC diagrams (Suppliers, Inputs, Process, Outputs, Customers) provide a high-level perspective that identifies key elements before detailed mapping begins. They're excellent for establishing process boundaries and stakeholders.
Hierarchical process maps start with a high-level process map overview and allow users to drill down into increasing levels of detail. This approach helps maintain the big picture while enabling detailed analysis through process mapping levels.
Data flow diagrams focus specifically on how information moves throughout a process, making them valuable for designing information systems and security protocols.
Business process mapping examples
If this all still seems a little abstract, here are a few real world examples of how companies can use process maps to evaluate and reimagine their workflows.
Customer onboarding: A financial institution uses swimlane mapping to visualize their customer onboarding process, revealing that new accounts require approvals from seven different departments. Upon redesigning the process, they reduce onboarding time from twelve to three days, saving time and money and dramatically improving customer satisfaction.
Manufacturing workflow: A consumer electronics manufacturer creates a value stream map of their assembly line and learns that products spend 70% of their time waiting between stations. They subsequently reorganize their workflow, reducing lead time by 40% and increasing daily output by 25%.
Insurance claims processing: An insurance company maps their claims process using a hierarchical approach, finding that 30% of claims end up on an exception path that delays resolution. The business process map guides them to standardize these exceptions, reducing average processing time by 45%.
IT service desk: A technology department documents their incident response procedures, identifying unnecessary escalations that consume senior staff time. The resulting, revised business process diagram reduces escalations by 60% and improves first-call resolution rates.
What's the difference between process mapping and modeling?
While often used interchangeably, process mapping and modeling are quite different in level of complexity and technicality. Process modeling is a methodology for documenting and optimizing workflows undertaken by engineers and efficiency specialists, often for complex processes like manufacturing, while process mapping is a method for documenting workflows that doesn’t require a lot of specialized knowledge.
{{business-process-mapping-guide="/utility/styleguide/cms-tables"}}
Process map symbols
Although less technical than process modeling, there is a certain amount of specialized knowledge required to make a process map — and that’s having an understanding of the standardized process map symbols and how to use them.
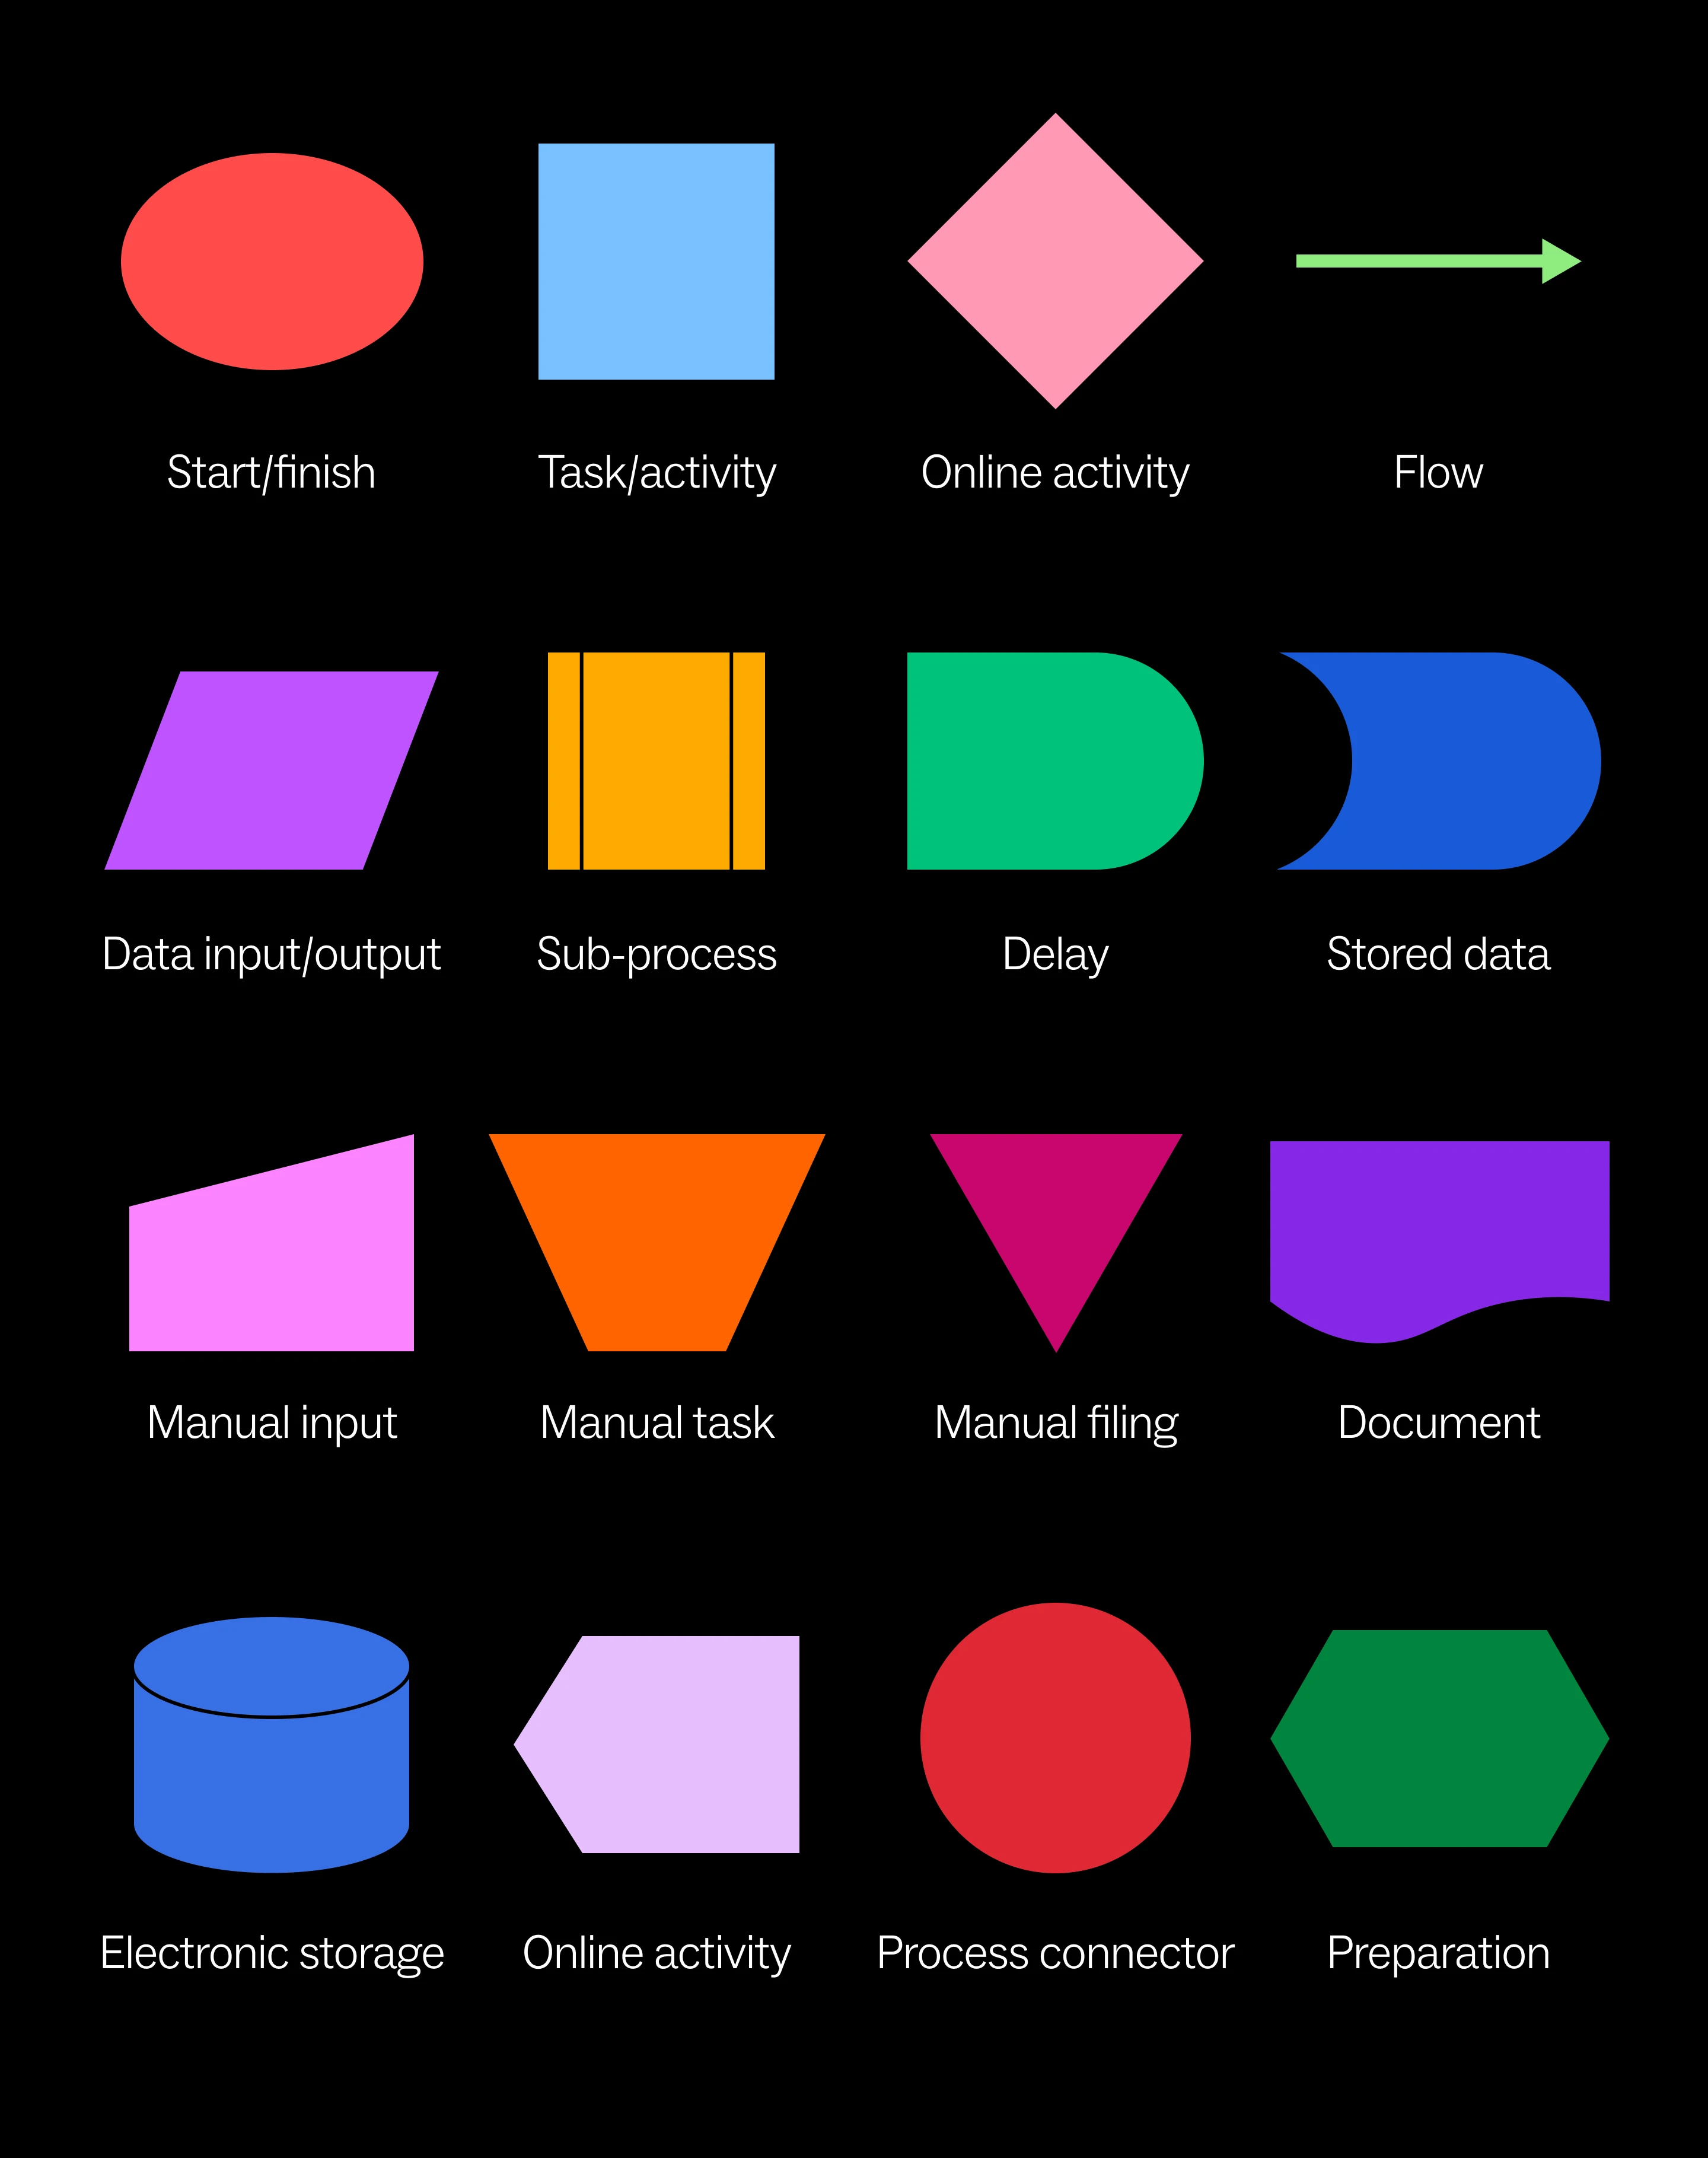
Want to see how these symbols work in practice? Check out the process flowchart template.
How to create a process map for businesses
Define the process scope
Begin by clearly identifying the process boundaries — where it starts, where it ends, and what's included or excluded.
Gather the right team
Include representatives from all areas involved in the process, especially those with hands-on experience. Include cross-functional partners to prevent blind spots and build buy-in for any resulting changes.
Document the current state
Start by listing all activities in the process sequentially. Base your list on direct observation rather than assumptions; often, the way processes work in actuality is quite different from how people think they work. Document exceptions and variations, not just the ideal path.
Create the visual map
Choose the appropriate business process mapping techniques based on your objectives. Start with a high-level process map before drilling down into a detailed process map. Use standard process map symbols consistently and verify the flow with participants.
Analyze for improvement
Review the completed business process diagram to identify redundancies, bottlenecks, unnecessary approvals, and other inefficiencies. Look for process loops, excessive handoffs, and activities that don't add value.
Implement and maintain
Use the insights to design and implement improvements. Create a process for keeping business process maps updated as workflows evolve to maintain their value as living documents.
Get more tips for strategic planning here.
Business process mapping best practices
Follow these business process mapping best practices to ensure you get the most bang for your buck.
- Define clear objectives. What do you hope to achieve by mapping a process? Standardization? Automation? Efficiency? Or something else?
- Involve the doers. The people who are working within the process every day will have the best understanding of how it tends to go, including workarounds and exceptions.
- Be consistent. Establish standards for symbols, naming conventions, and detail level to ensure maps are easily understood across the organization.
- Balance detail with usability. Too little detail limits a map's value; too much creates confusion.
- Validate with data. Include performance metrics to ground improvement efforts in facts rather than opinions.
- Make maps accessible. Save business process diagrams where they’re easily accessed by people who need to see them — ideally in business process mapping software where they can easily be updated and refined.
- Review regularly. Schedule periodic reviews to ensure maps reflect current operations, especially after organizational changes or implementation of new systems.
Challenges of building a detailed process map for your company
Nothing worth doing is easy, and there are a few challenges that could arise when you start the process of creating a process map. Employees may resist being transparent out of fear that their jobs will change or their position will be eliminated. It may be difficult to document exceptions to the normal processes without making maps overly complex. And resourcing can be a burden; it can be tough for busy staff to find time to document their processes while having to keep doing them every day.
Once the initial map has been created, it can easily fall by the wayside without a maintenance strategy, leading to out-of-date maps that do more harm than good. To that end, care should be taken to make sure your process maps remain flexible enough to update; overly rigid process definitions can stifle your team’s ability to evolve, particularly in creative or judgment-intensive work. After your process map has been optimized, it’s critical to develop a plan to implement it; you could have the perfect map, but without a strategy to socialize it, train employees, and integrate it into your workflow it won’t be of much use to anyone.
Why Mural is the ideal business process mapping tool
Process mapping is a visual exercise, and there’s no better tool for visual collaboration than Mural. Mural has a number of features that make it the ideal choice for process mapping:
- Templates: Mural offers pre-built templates for many of the workflows you’d want to visualize, including business model templates, swimlane diagrams, and SIPOC diagrams.
- Cross-functional collaboration: Mural is an easily-shareable centralized location for sync and async collaboration, so stakeholders across the org can help refine the process map.
- Integrations: Mural integrates with planning and productivity platforms like Jira, Azure DevOps, and Asana, so you can easily import and sync tasks for an in-depth exploration of your workflows.
- Presentations: Mural’s presentation mode, Teams integration, and Facilitation Superpowers™ enable you to share your process maps to stakeholders in meetings, for real-time brainstorms and adjustments.
- AI: Mural AI can help speed up the business mapping process with features like build a template, automatic clustering, and information summaries.
- Security: Mural meets the most stringent enterprise security requirements, making it a safe place to host process maps containing sensitive and proprietary information.
Try Mural for free
Ready to transform how your organization visualizes, analyzes, and improves business processes? Take the first step with a free trial of Mural's visual collaboration platform. Experience how visual process mapping can unlock efficiency and innovation in your workflows.
.webp)

%20(2).avif)


