On this page
Use Fishbone diagram template
Get started
Analyze a problem by looking at its root causes through six different lenses

When solving a problem, it’s essential to understand all the underlying root causes of the problem to arrive at a more effective solution. A fishbone diagram template will help you and your team quickly get started visualizing all the potential root causes and working to find the most effective plan of attack.
Identify root causes of complex problem
Improve understanding with stakeholders
Brainstorm ideas and collaborate to fix bottlenecks
Build new processes and prevent reoccurring issues
Follow these steps to identify possible causes & effects with the simple fishbone diagram template.
Your problem statement is the main issue your team is facing that you’re looking to solve. It’s also central to your diagram. Phrase your problem statement as a question that you’re looking to answer, something like “Why are we seeing a lower manufacturing yield?” or “Why have our customer service scores dropped?” On your diagram, write out your problem statement in the head of the fish.
Your team needs to agree on the main possible contributors to the main problem. Is there a failure with your equipment? Processes? People? You’re not identifying the individual causes themselves, just the broader categories that could be contributing factors for the problem. The categories you choose might depend on your particular problem statement or industry.
In manufacturing, for instance, Ishikawa diagrams usually default to the “6 Ms”: machines, materials, manpower, mother nature, measurements, and methods. Your categories will make up the main branches of your fishbone diagram. Six is usually a good number to aim for, with three branching off of the top half and three branching off of the bottom half.
Hold a brainstorming session with your team to identify what could be going wrong in each of the six categories of causes. This is where you want to drill down and get as specific as possible to identify the root cause of the problem.
If you think there’s a problem with the process, brainstorm exactly what could be going wrong. Are team members skipping steps? Is the training outdated? Write in the potential causes of a problem as spokes to fill out your diagram.
Some recommended methods include conducting a 5 why exercise, or outlining your ideas with a mind map.
Pro-tip: Your root cause analysis may show that you have sub-causes, or smaller issues that contribute to the larger problem you’re facing.
Once you have your diagram filled out, you can see all of the potential root causes laid out cleanly. Use this visual tool to discuss with your team, then vote to determine the biggest underlying contributors to address first.
Decide on next steps to address the root cause. Assign action items to team members and come up with a timeline for making progress toward your goals.
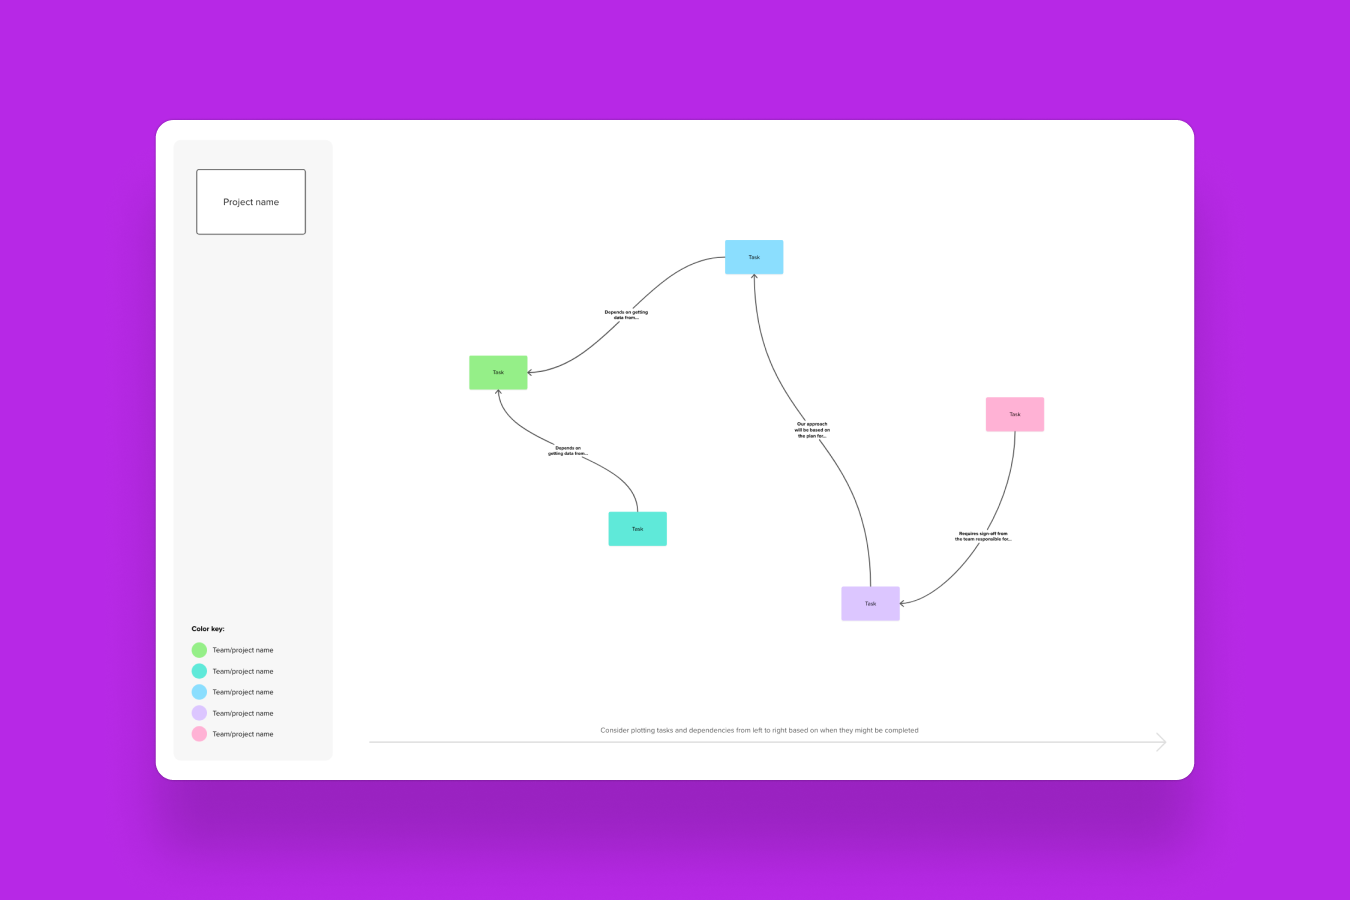
Use visual cues and color coding: Utilize visual cues and color coding to highlight the significance and prioritize the causes identified. This helps team members easily understand and focus on the most critical factors that contribute to the problem.
Guide problem-solving with the team: Try guiding the team through a structured analysis of the causes identified. Encourage discussions on the potential impact and likelihood of each cause, and facilitate decision-making to prioritize the causes based on their significance.
Encourage open and collaborative discussions: Foster an environment where team members feel comfortable sharing their insights and perspectives. Encourage active participation, brainstorming, and the free exchange of ideas to capture a comprehensive range of potential causes.
The fishbone diagram was famously used by Dr. Kaoru Ishikawa, who popularized the diagram in the 1960s and is credited with being one of the founding fathers of modern quality management.
Head: At the head of the diagram, write down the problem or effect you want to analyze. This problem statement serves as the central focus of the diagram.
Major categories: The horizontal line attached to the ‘head’ of the fishbone represents the major categories or branches. These categories are typically the main causes or factors that can contribute to the problem. Common categories include people, process, equipment, materials, and environment.
Sub-causes: The diagonal lines that resemble fishbones are for identifying and listing the sub-causes or factors that could be responsible for the problem. These sub-causes represent the potential reasons contributing to the main causes.
Analysis and prioritization: Once you have identified the sub-causes, analyze and evaluate them. Assess the potential impact and likelihood of each cause, considering factors such as frequency, severity, and cost implications. Prioritize the causes based on their significance or importance to the problem at hand.
Don’t limit the exercise to one person or even just one team. Fishbone diagrams are meant to be filled out collaboratively, and you’ll source the best ideas if you work across teams and departments to identify the potential root causes of your problem statement.
Invite team members from multiple departments to the exercise, and give everyone the chance to brainstorm ideas about potential root causes.
As many as you’d like! This is the beauty of fishbone diagrams and fishbone diagram exercises. As you dig deeper into root causes, keep asking “why” a particular cause is happening. If “people” is one of your main categories, maybe “high staff turnover” is a cause. But that won’t necessarily be the root cause. Keep digging with your team and build out more spokes until you’ve identified all the potential issues at the core.