What is a flowchart?
A flowchart is a diagram that uses symbols and arrows to visualize a process. These visual tools, also known as flow diagrams, are a handy way to design and document each step in a workflow and illustrate how they’re interconnected. Using a standardized set of symbols, including shapes and arrows, flowcharts make it possible to show complex processes with a shared visual language.
What are flowcharts used for?
Flowcharts first emerged in the computing world back in the 1940s. As Indiana University professor Nathan Ensmenger explained, “The idea was that an analyst would examine a problem, design an algorithmic solution, and outline that algorithm in the form of a flowchart diagram.”
But flowcharts aren’t just for computer programming. Today, flowcharts are a powerful tool for building and documenting virtually any process, whether simple or complex. They’re used in a wide variety of disciplines and fields, from software development to education to business operations and beyond.
What are the benefits of using flowcharts?
Flowcharts are a powerful tool for visualizing processes, offering several benefits that enhance communication, collaboration, and understanding across various contexts. Here are some key ways in which using a flow diagram can be beneficial:
- Clarifies complex processes: Flowcharts break down complex procedures into more manageable, sequential steps. This visualization helps to simplify understanding by showing the flow from one step to another in a logical manner.
- Enhances communication: By providing a visual representation of a process, flowcharts facilitate clearer communication among team members and stakeholders. They help ensure that everyone understands the flowchart process in the same way, reducing misunderstandings and miscommunications.
- Identifies redundancies and inefficiencies: Flowcharts can help identify areas within a process that aren’t working as they should be. By laying out each step visually, it becomes easier to see where delays, unnecessary steps, or bottlenecks occur, which can then be addressed to streamline the process.
- Improves problem-solving: With a clear visual map of a process, it's easier to pinpoint where issues are occurring. Flowcharts enable problem-solvers to focus on specific stages of a process where improvements are needed, facilitating more targeted and effective solutions.
- Facilitates training and onboarding: For new employees or team members, flowcharts serve as an excellent training tool. They provide a quick overview of how processes work, which helps new hires understand their roles and responsibilities within the broader system more quickly and thoroughly.
- Supports documentation and standardization: Flowcharts are useful for documenting processes for consistency and standardization. They ensure that everyone follows the same process steps, leading to consistent outputs and quality control.
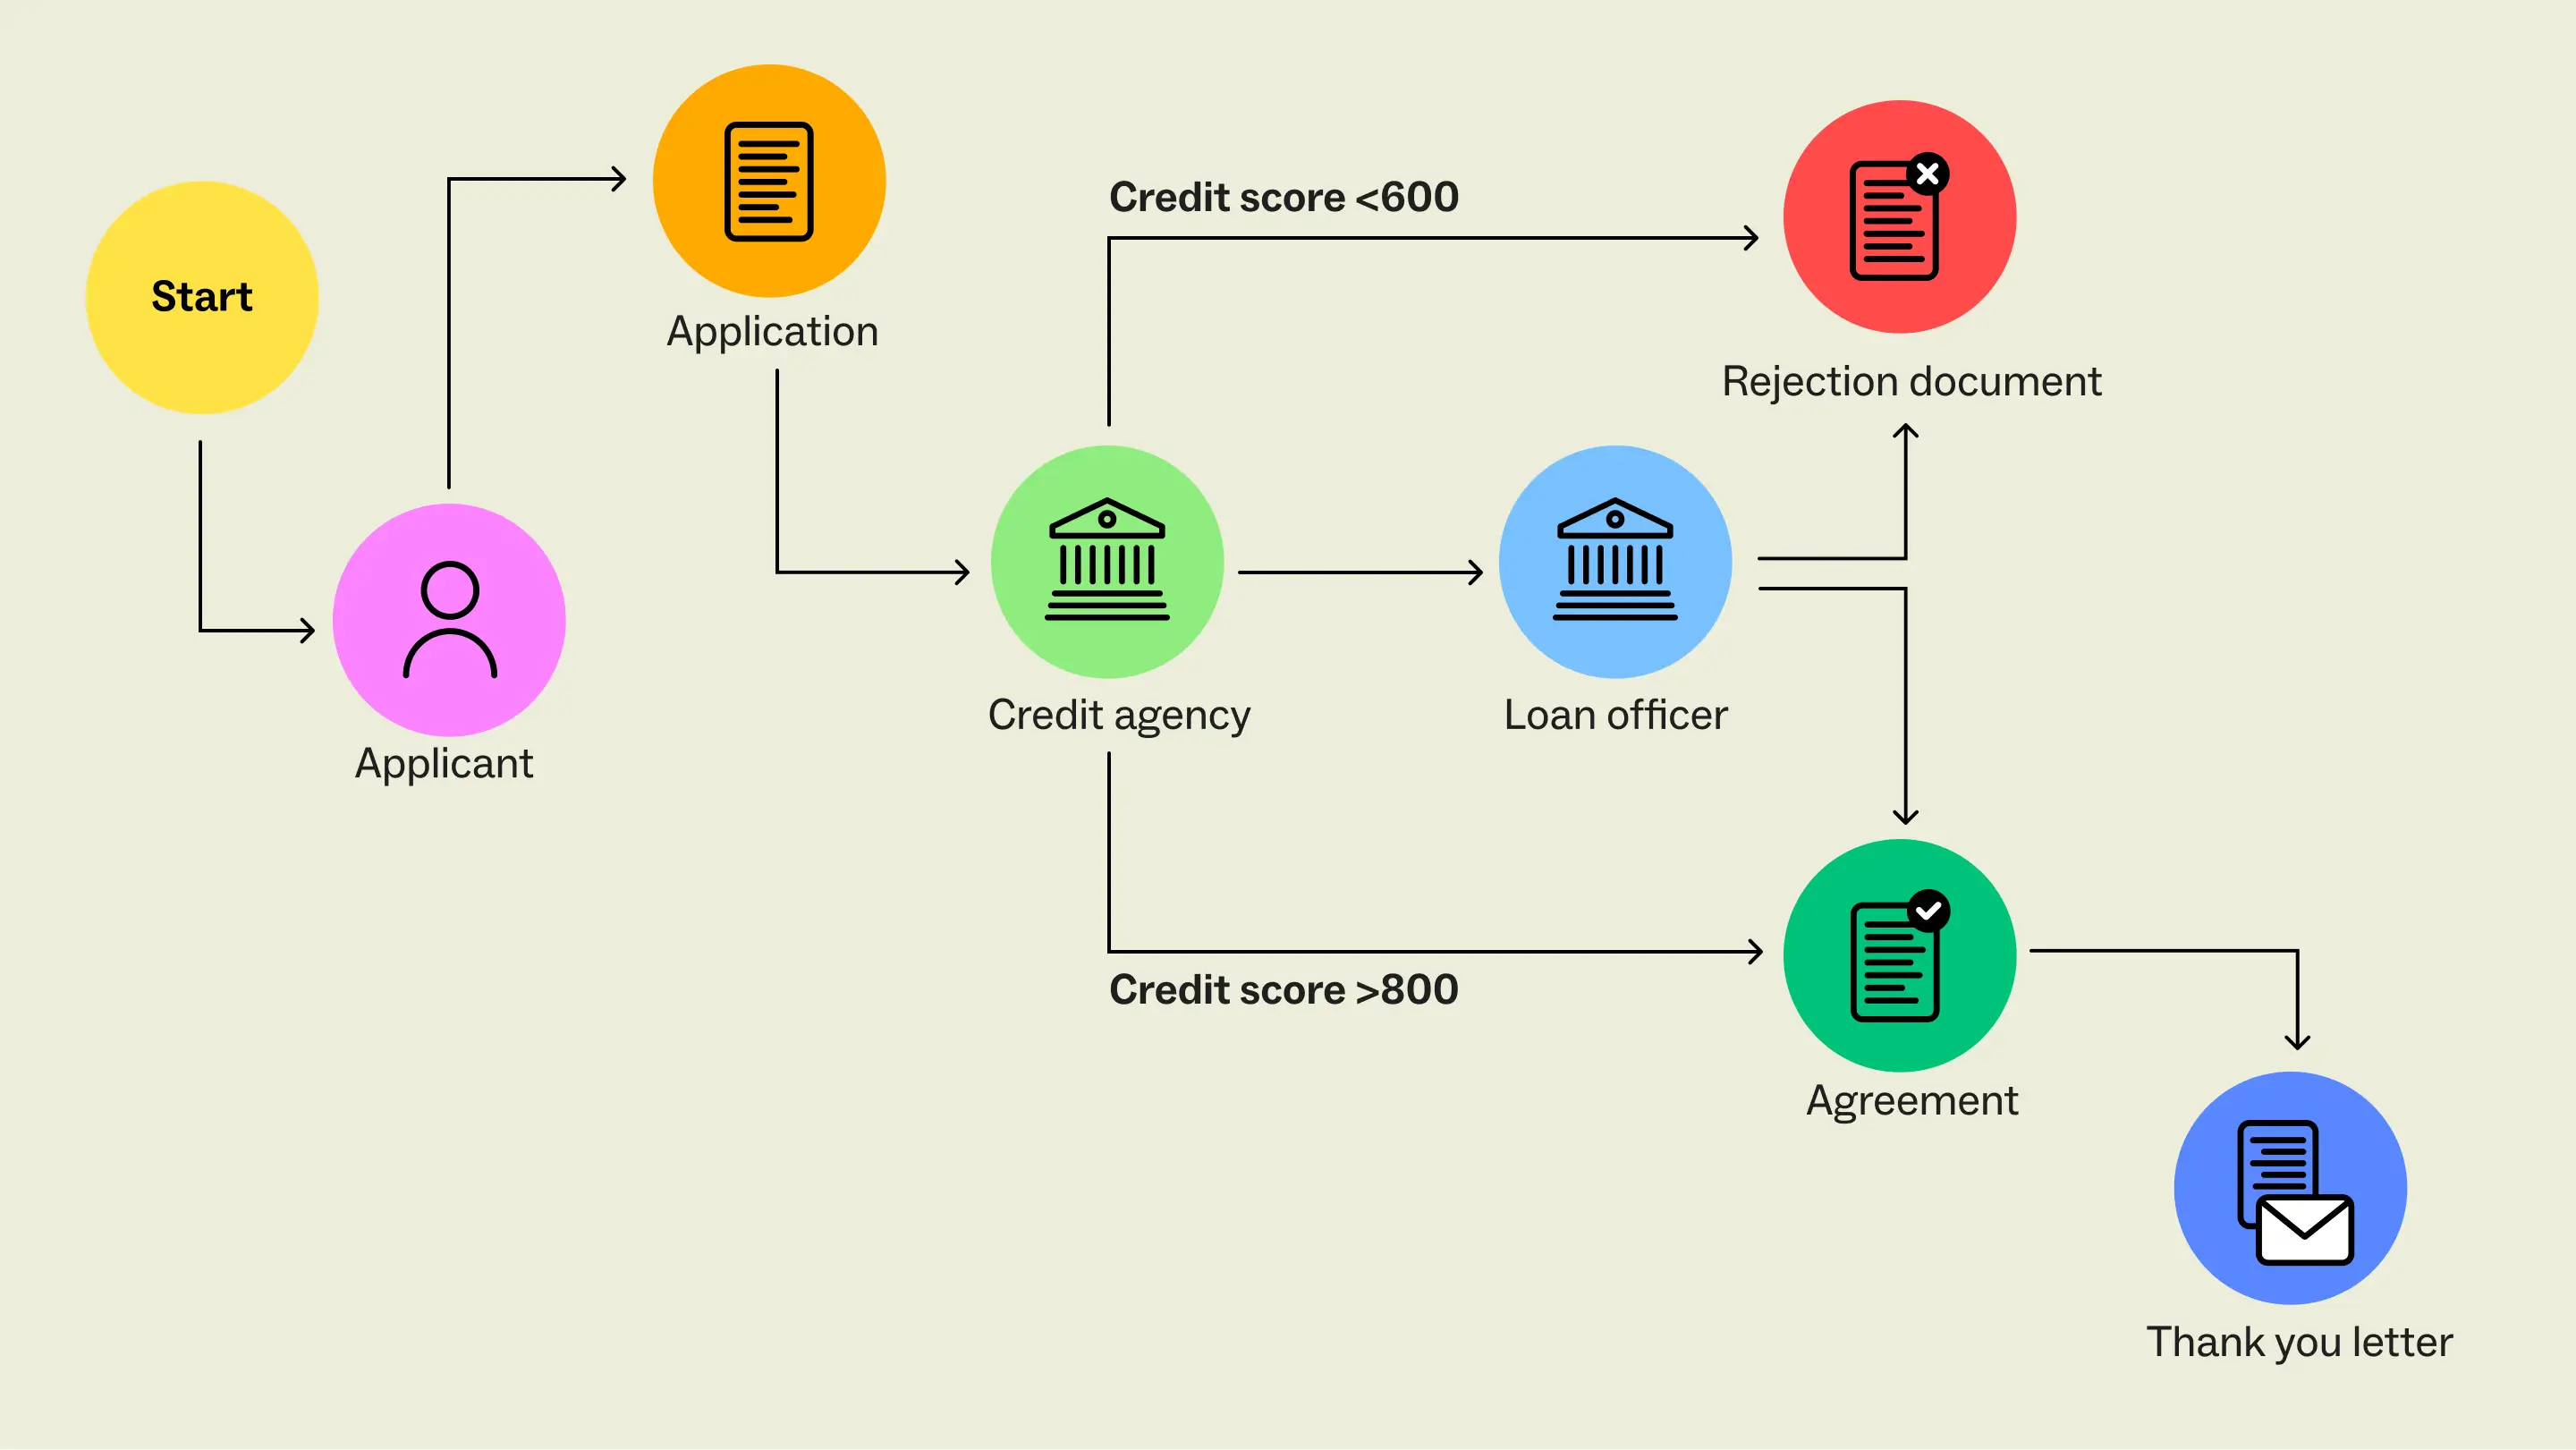
- Aids decision-making: Decision points are clearly marked on flowcharts, showing where decisions need to be made and what the subsequent steps should be based on these decisions. The clarity provided by defined decision points supports quicker and more informed decision-making within a team or organization.
- Encourages collaboration: By visualizing the process, team members can see how their work interconnects with others. This understanding can improve workplace collaboration, as people understand their roles in the larger process and where they fit in.
- Supports continuous improvement: Flowcharts aren't static; they can be updated and modified as processes change and improve. This adaptability makes them an excellent tool for continuous improvement efforts within an organization.
- Provides a tool for compliance and quality control: In industries where compliance with standards is crucial, flowcharts help ensure adherence to required processes. They can be used as a part of quality control systems to help maintain high standards.
Demystifying flowchart symbols
At first glance, flowcharts and diagrams can look overwhelming. What do all the different shapes mean? But when we take some time to understand flowchart symbols’ meanings, they start to tell a visual story. They indicate when a process starts, the logic that makes it progress, and when it comes to an end.
Basic flowchart symbols
Let’s start with the basics. These are the five symbols you’ll most commonly find in a simple flowchart example:
- Terminator, Start/End: Every process has a start and an end point. Use the oval shape to identify both moments.
- Action, process: The rectangle shape is used for actions or instructions, the things that must be done.
- Decision: The diamond shape indicates a step in the process that asks a question or requires a decision.
- Connector: Use a circle when leaping from one action to another.
- Flowline: Flowlines indicate the directional flow of the process and point to the next step.
Other common flowchart symbols
You can create most simple flowcharts using just five symbols—but you’re not limited to those shapes.
Different types of flowcharts incorporate different kinds of symbols. For example, Business Process Model and Notation (BPMN) diagrams use icons, while Unified Modeling Language (UML) diagrams use a much more complex notation system.
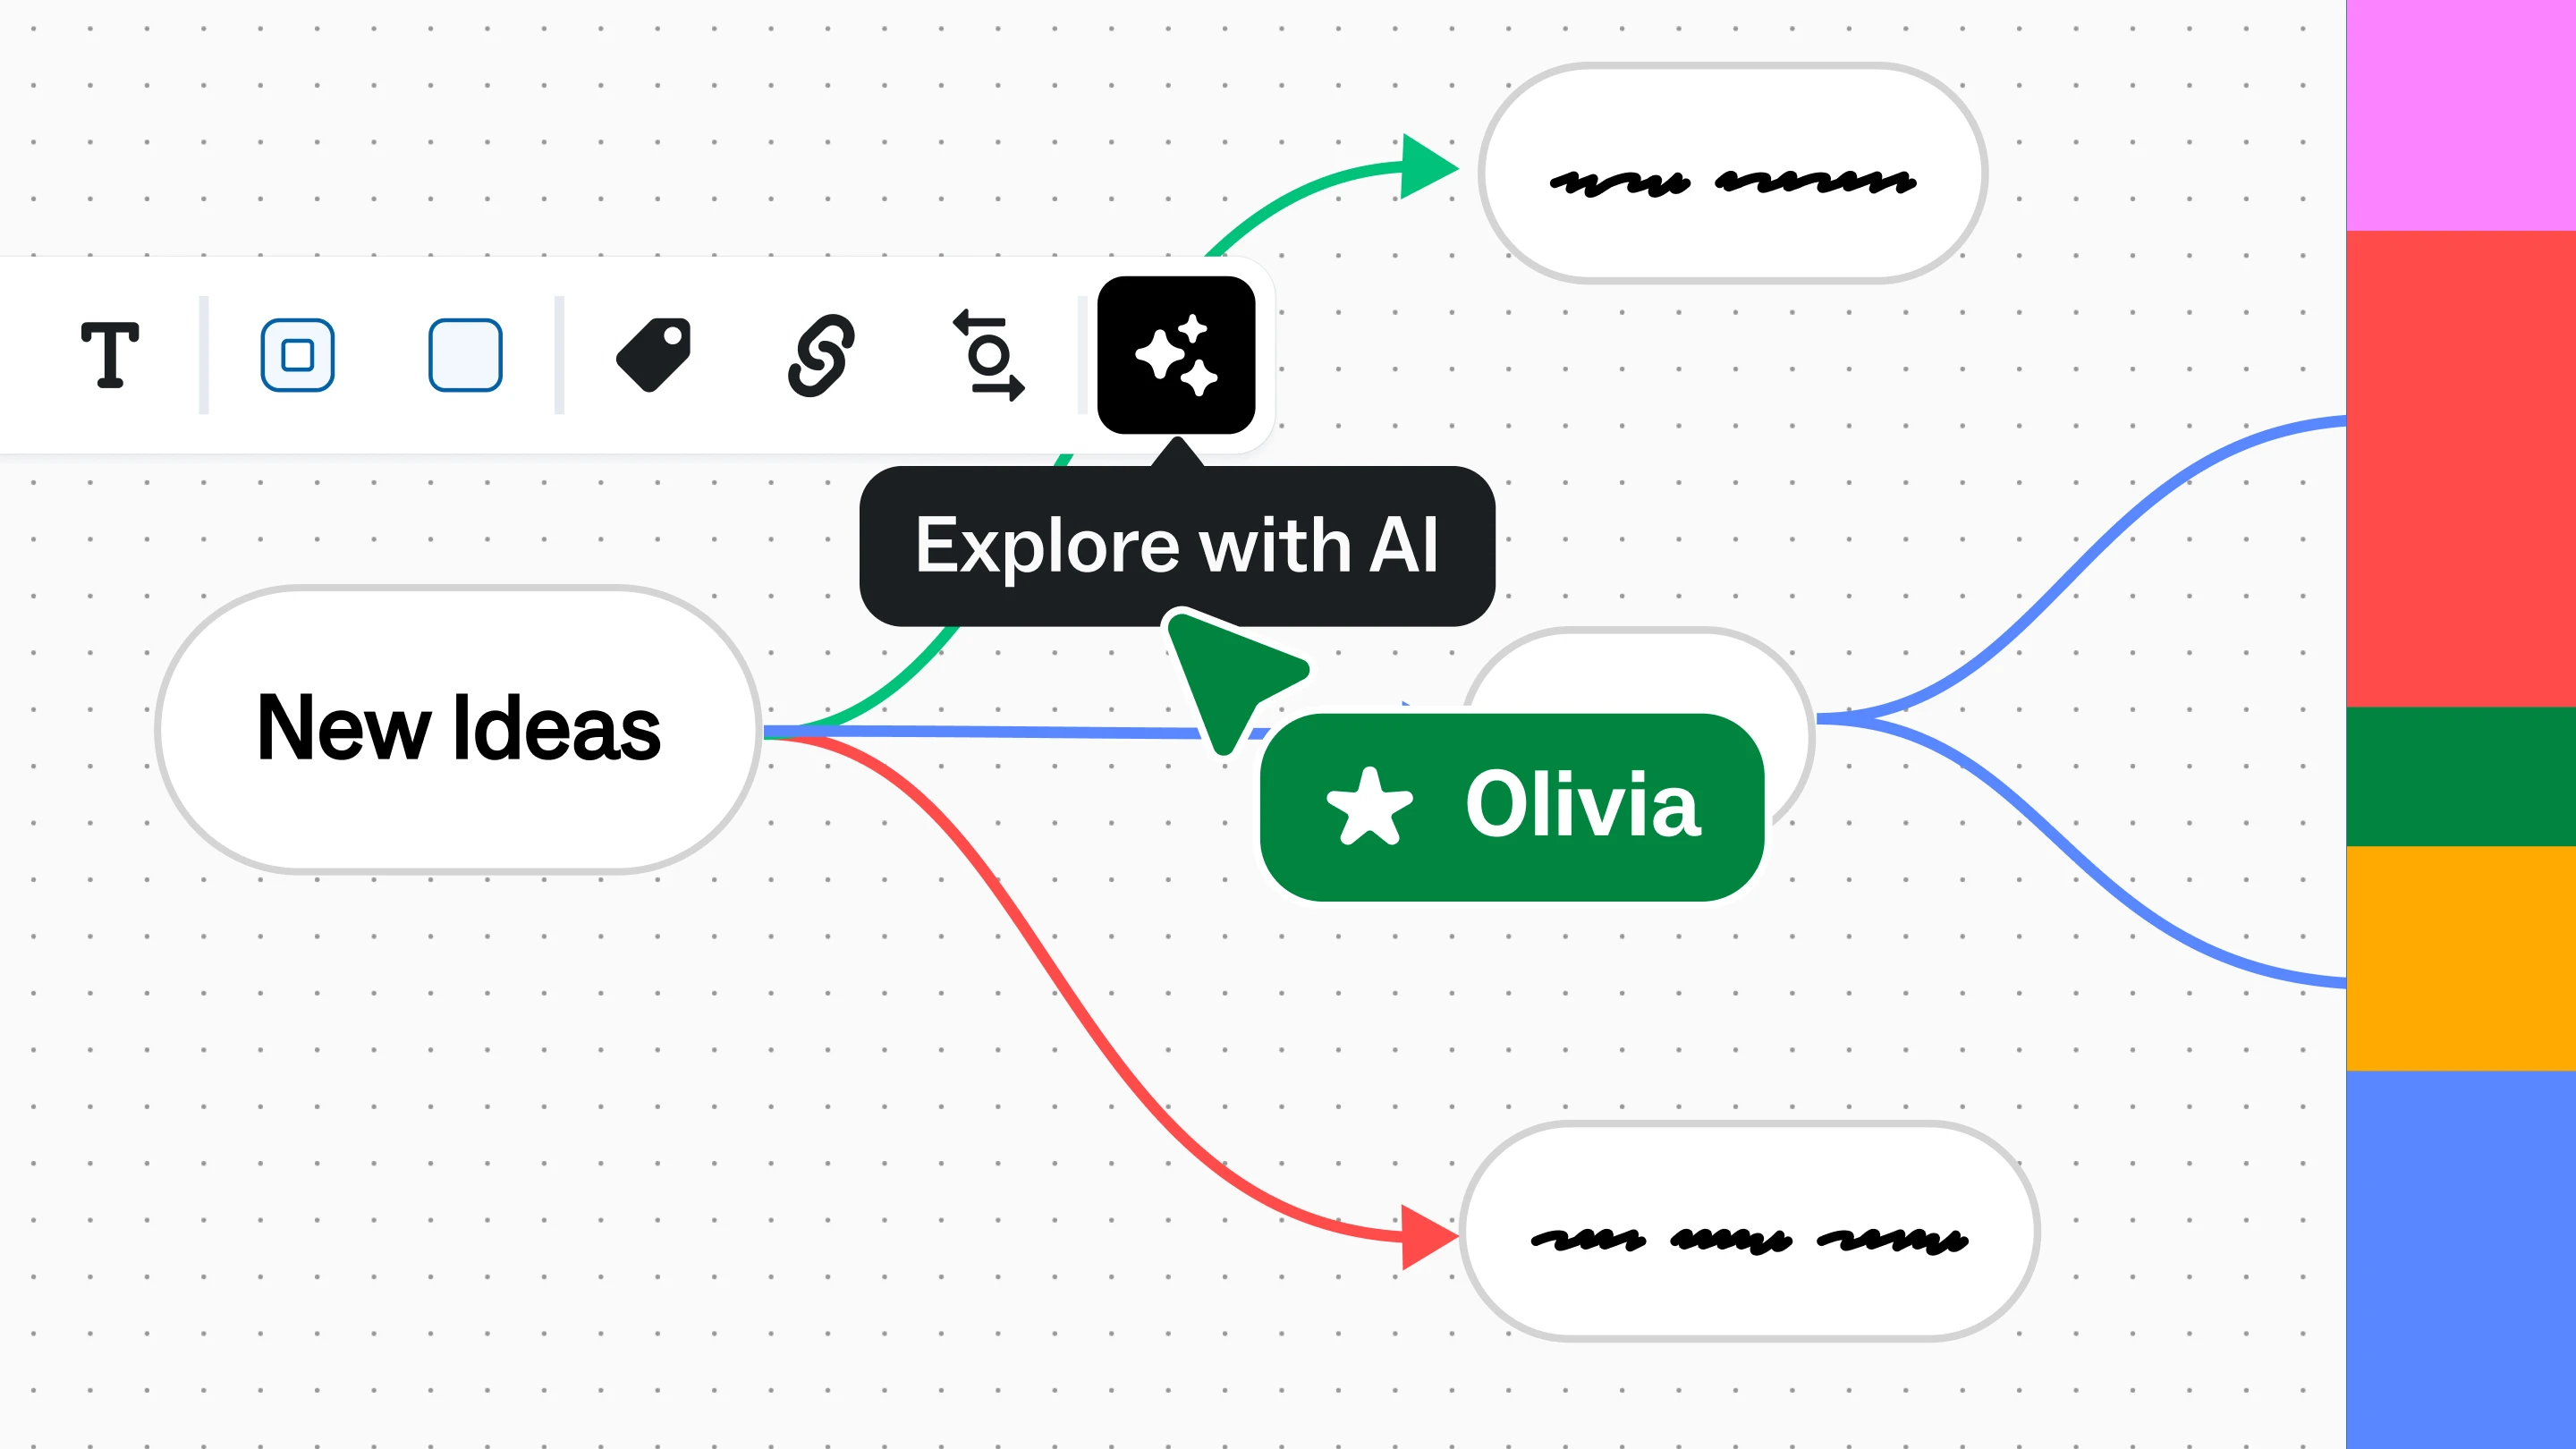
Some visual collaborators prefer to use less abstracted images to represent specific aspects of a workflow. For example, an app developer might use an image of a bug to represent all the QA steps in launching a new feature. Play around with your flowchart’s arrows, shapes, and symbols to find what works best for you.
Whatever visual language you use, make sure to be consistent so that the idea or process you are mapping is easily understood.
How to make a flowchart
For almost as long as we’ve had computers, we’ve had flowchart creation software. For serious diagrammers, like the folks mapping out computer algorithms, there are dedicated tools specifically for creating complex flowcharts. However, most people don’t need something quite so robust. In fact, you probably already use a tool that offers flowcharting capabilities—for example, Microsoft Excel, Google Docs, or Google Slides.
Unfortunately, these types of flowchart software have some limitations. Most flowchart makers are designed to be extremely linear, making it difficult to adjust and iterate on-the-fly. They also limit your team’s ability to collaborate on diagramming in real time. Instead, you’re left playing diagramming ping-pong with your teammates. This back-and-forth can cost you valuable time and prevent you from coming to solutions quickly as a cohesive team.
If you need a flowchart maker that allows you to collaborate—especially with a remote or distributed team—you need a visual collaboration platform. You can learn more about finding the right flowchart builder guide to enhance your team's efficiency.
Visual collaboration platforms are especially useful when you’re in the early stages of designing a flowchart. You’ll have more flexibility with a dynamic flowchart creator that makes it easy to drag and drop symbols and quickly connect the dots—and to do it collaboratively.
7 flowchart examples and templates to get you started
The possibilities for mapping and diagramming with flowcharts are endless. They can be used for something as simple as documenting a linear process, or as complex as describing a computer algorithm. So, how do you know which type of flowchart to create?
It all depends on your goal. Do you need to document a process for new employees? Understand everyone’s roles in a cross-functional project? Visualize the flow of data? There are specific types of flowcharts designed to do each of those jobs—and we’ve rounded up some common flowchart examples for you here.
Rather than starting from scratch, use a template to jumpstart your diagramming process. For each type of flowchart, we built an easy-to-use template based on insights from consultants, product teams, project managers—the people who do this every day.
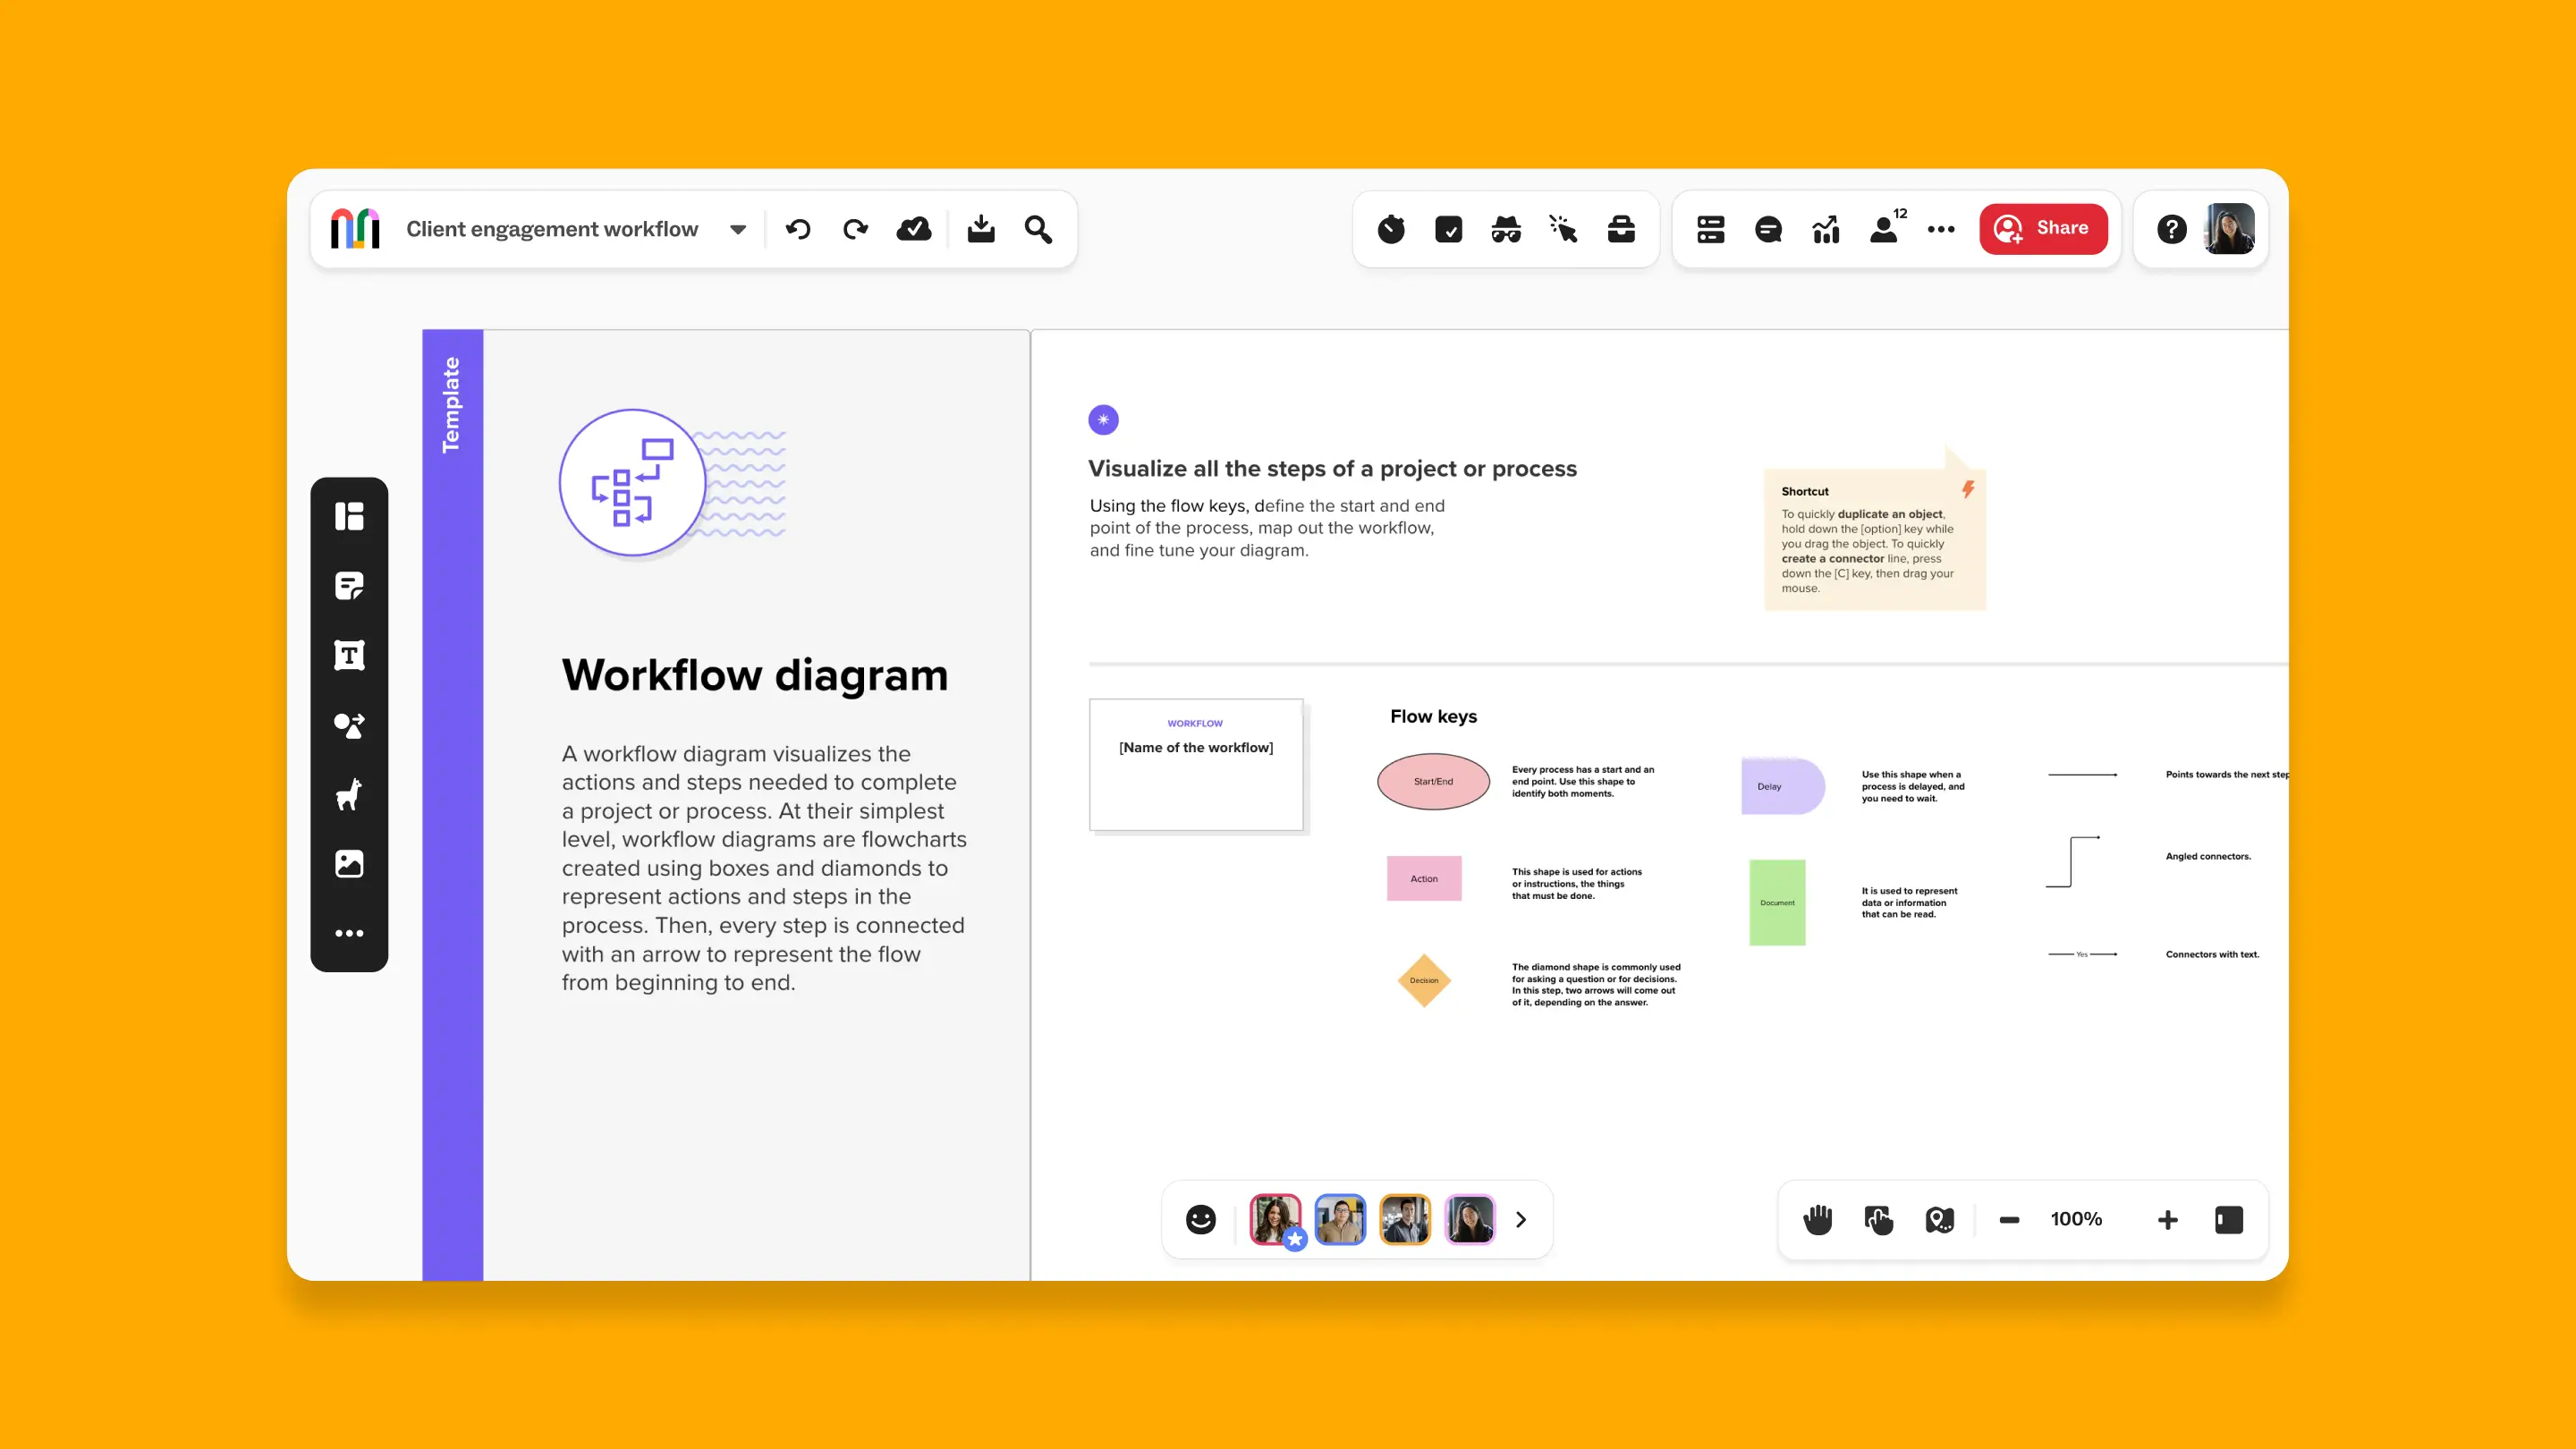
1. Workflow Diagram template
Use a workflow diagram (also called a workflow flowchart) to visualize all the actions and steps needed to complete a project or process.
2. Process Flowchart template
Use a process flowchart (also called a business process flow or process flow diagram) to visualize all the steps and inputs of a business process and identify opportunities for improvement.
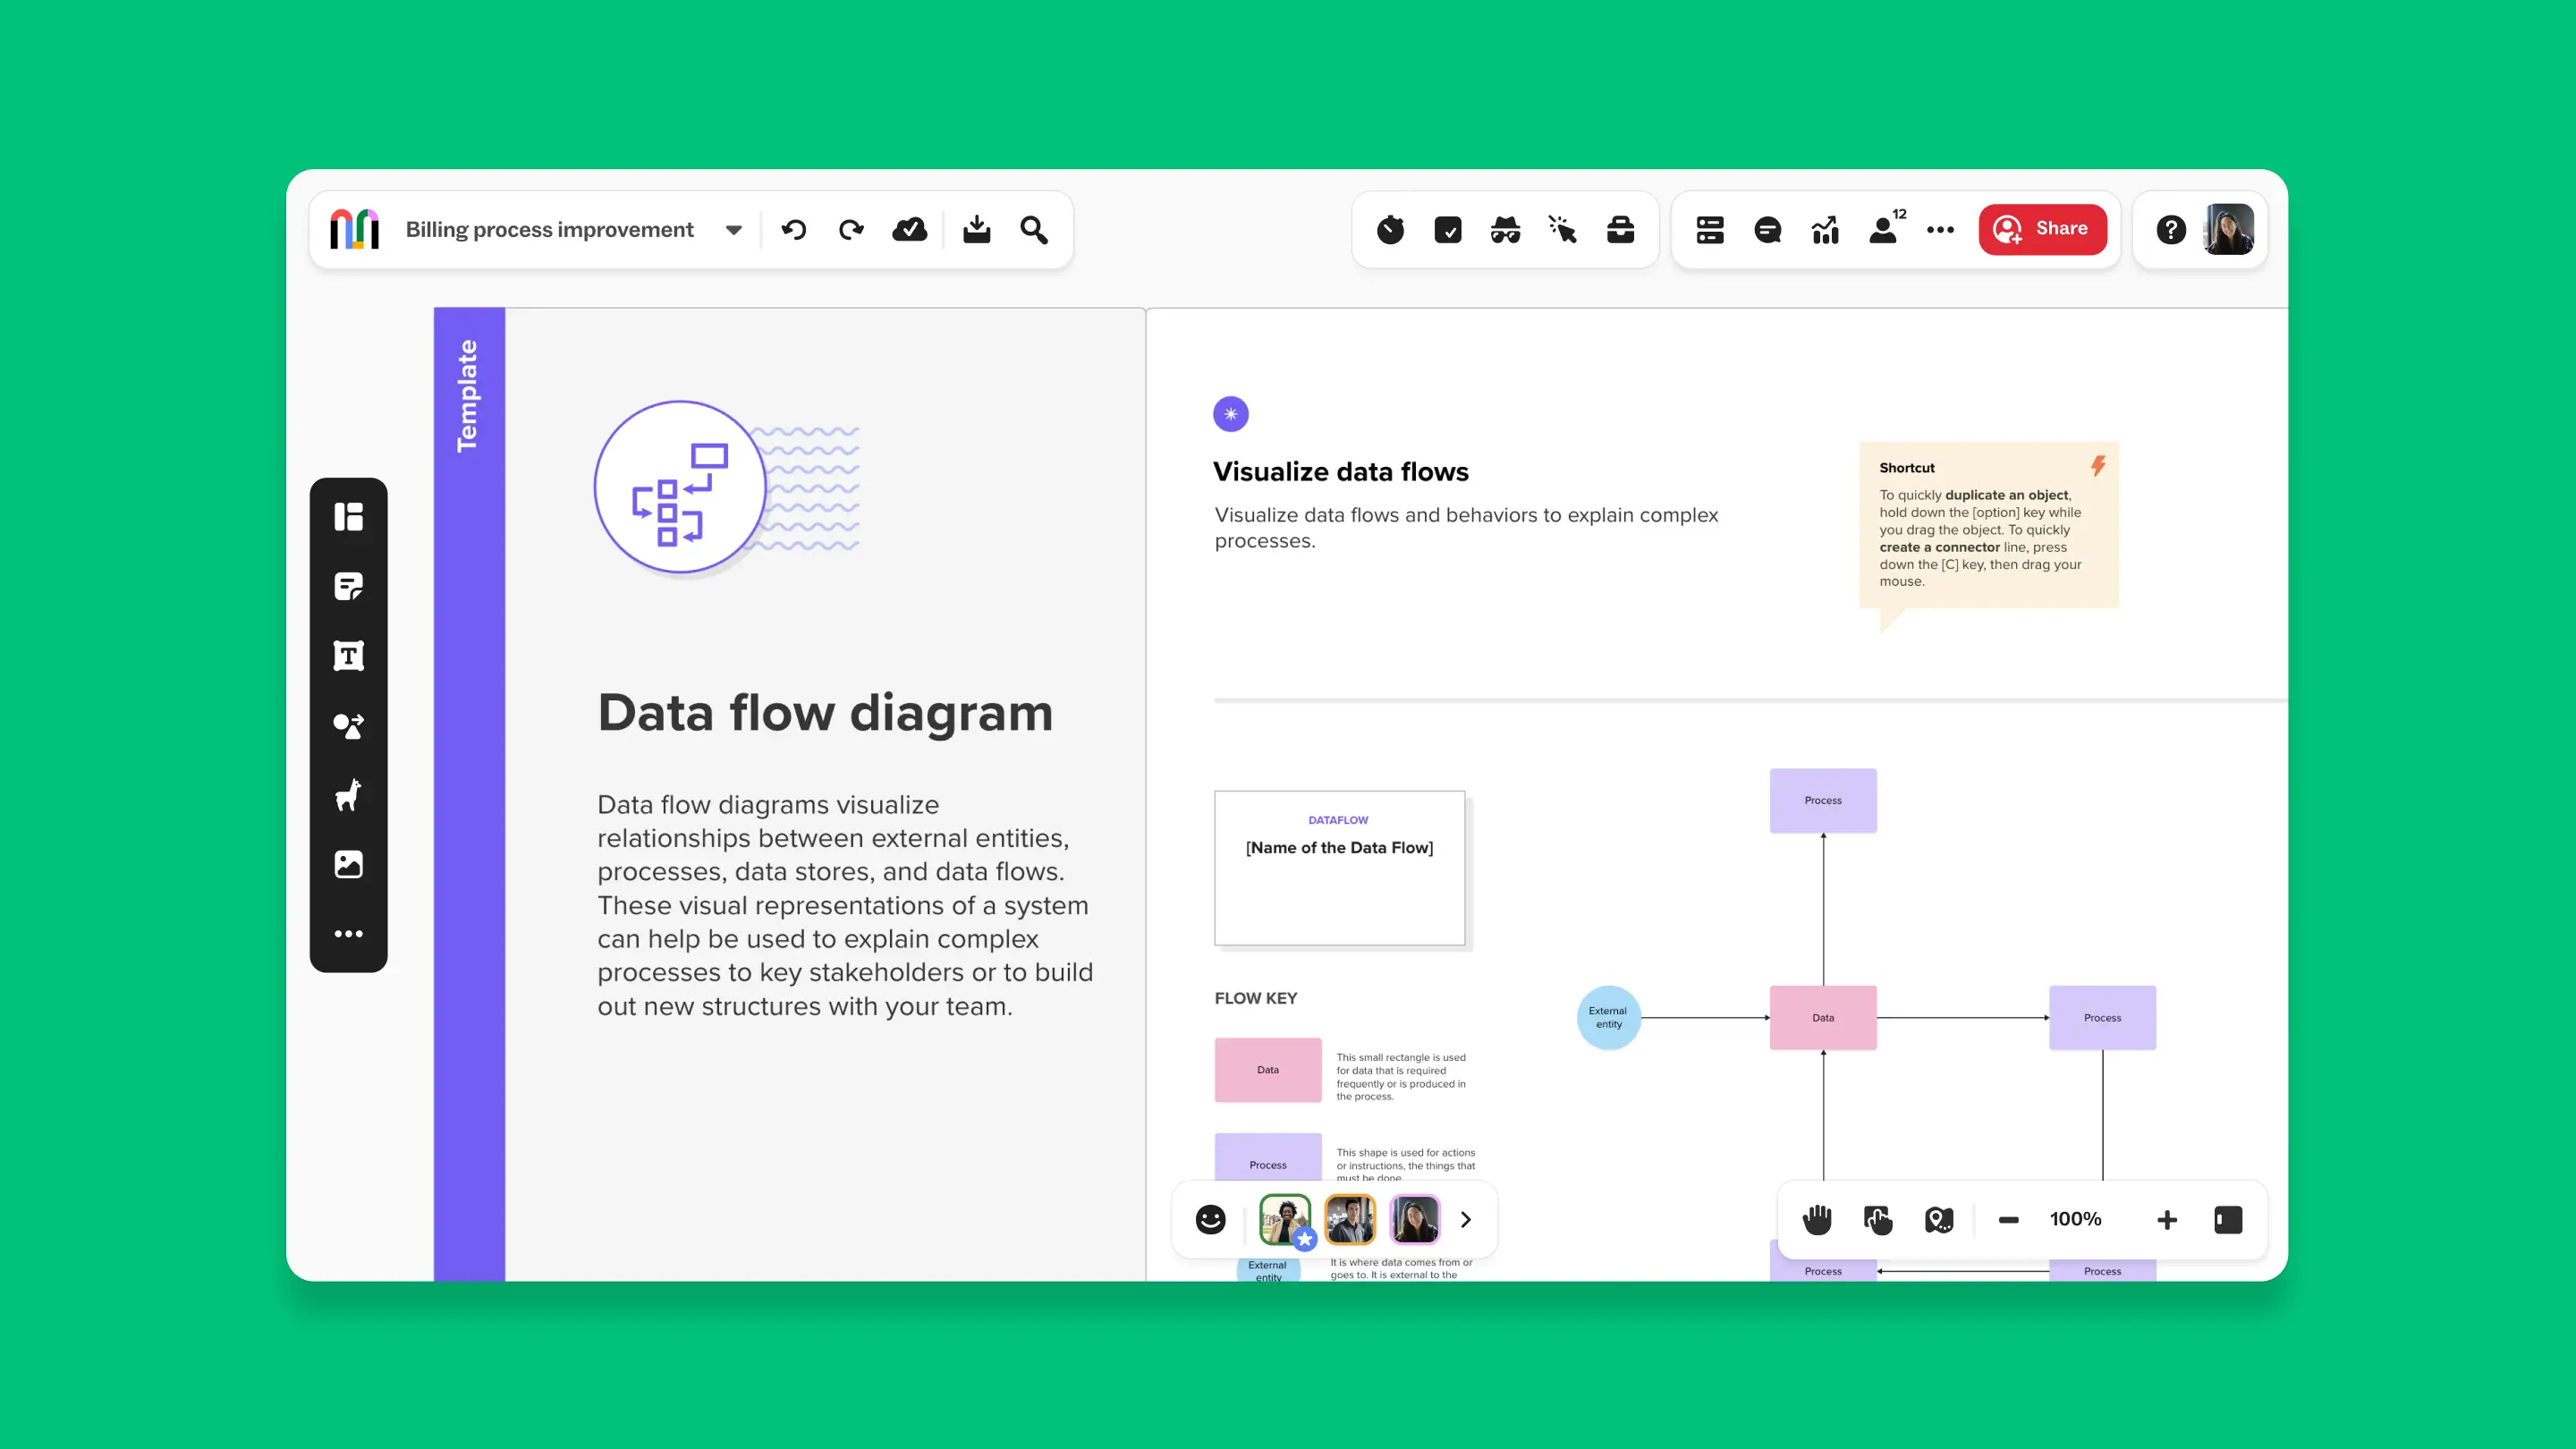
3. Data Flow Diagram template
Use a data flow diagram (DFD) to visualize and annotate how data flows within an information system or process.
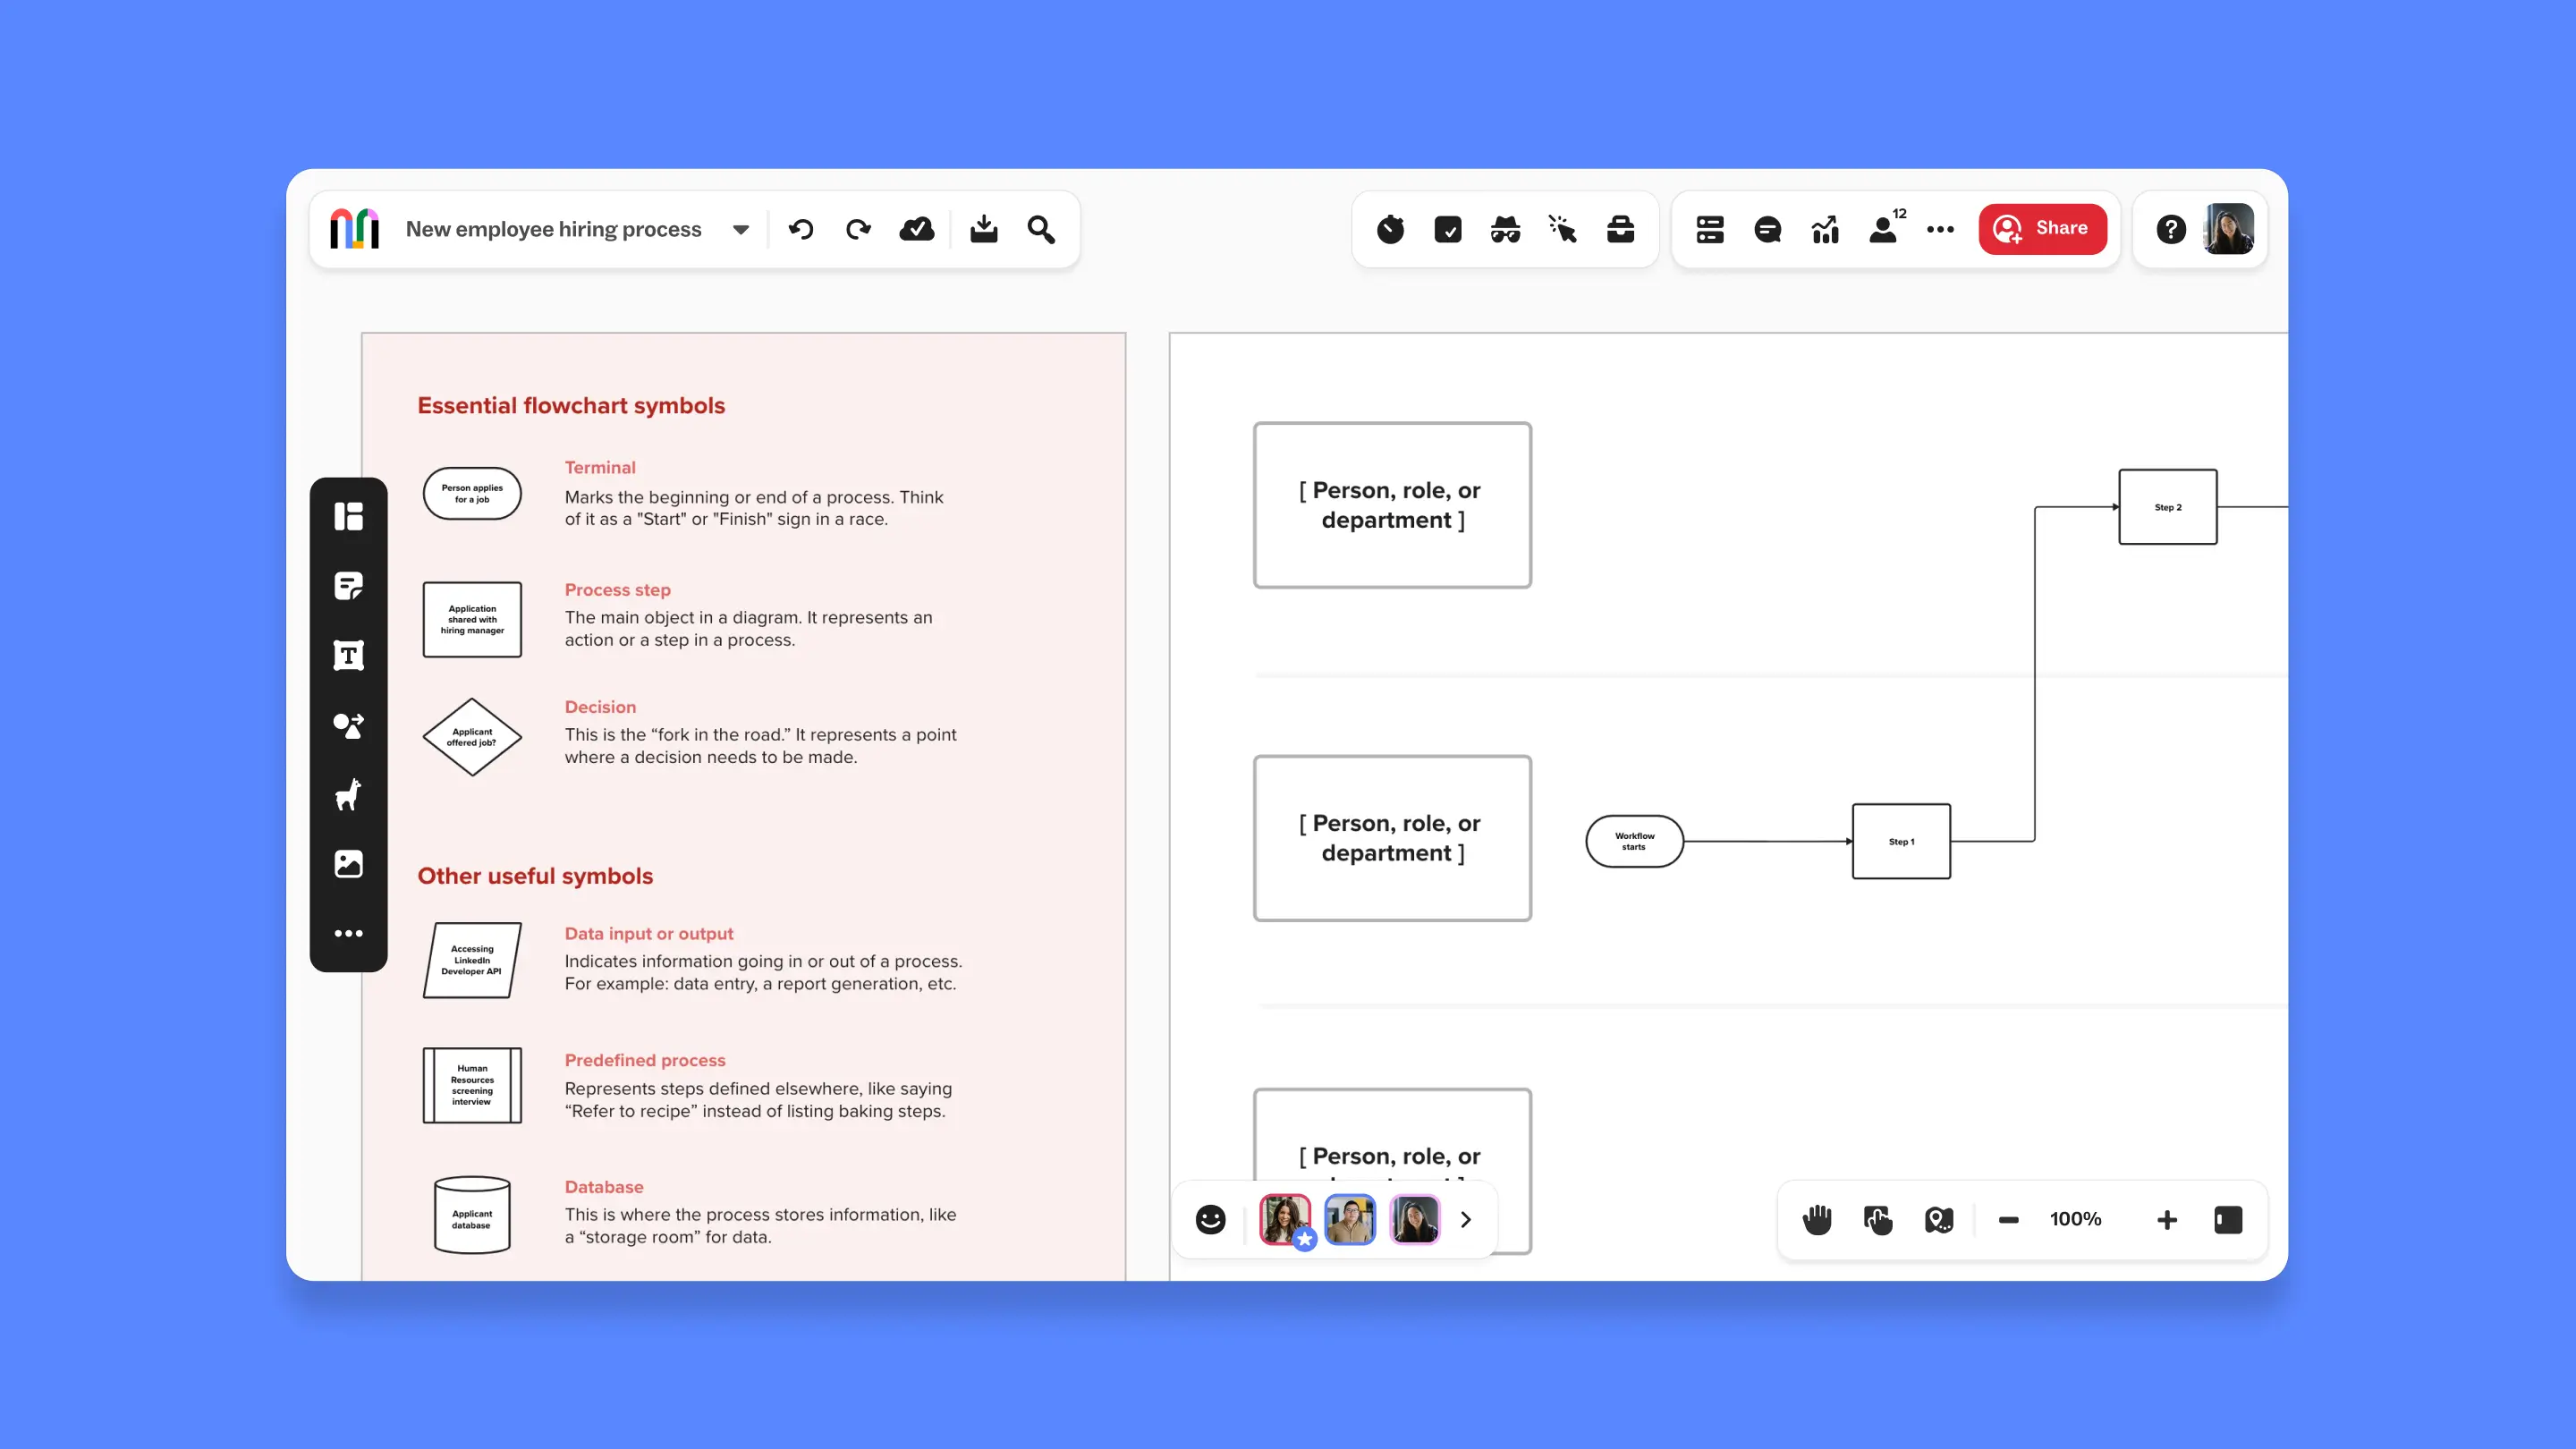
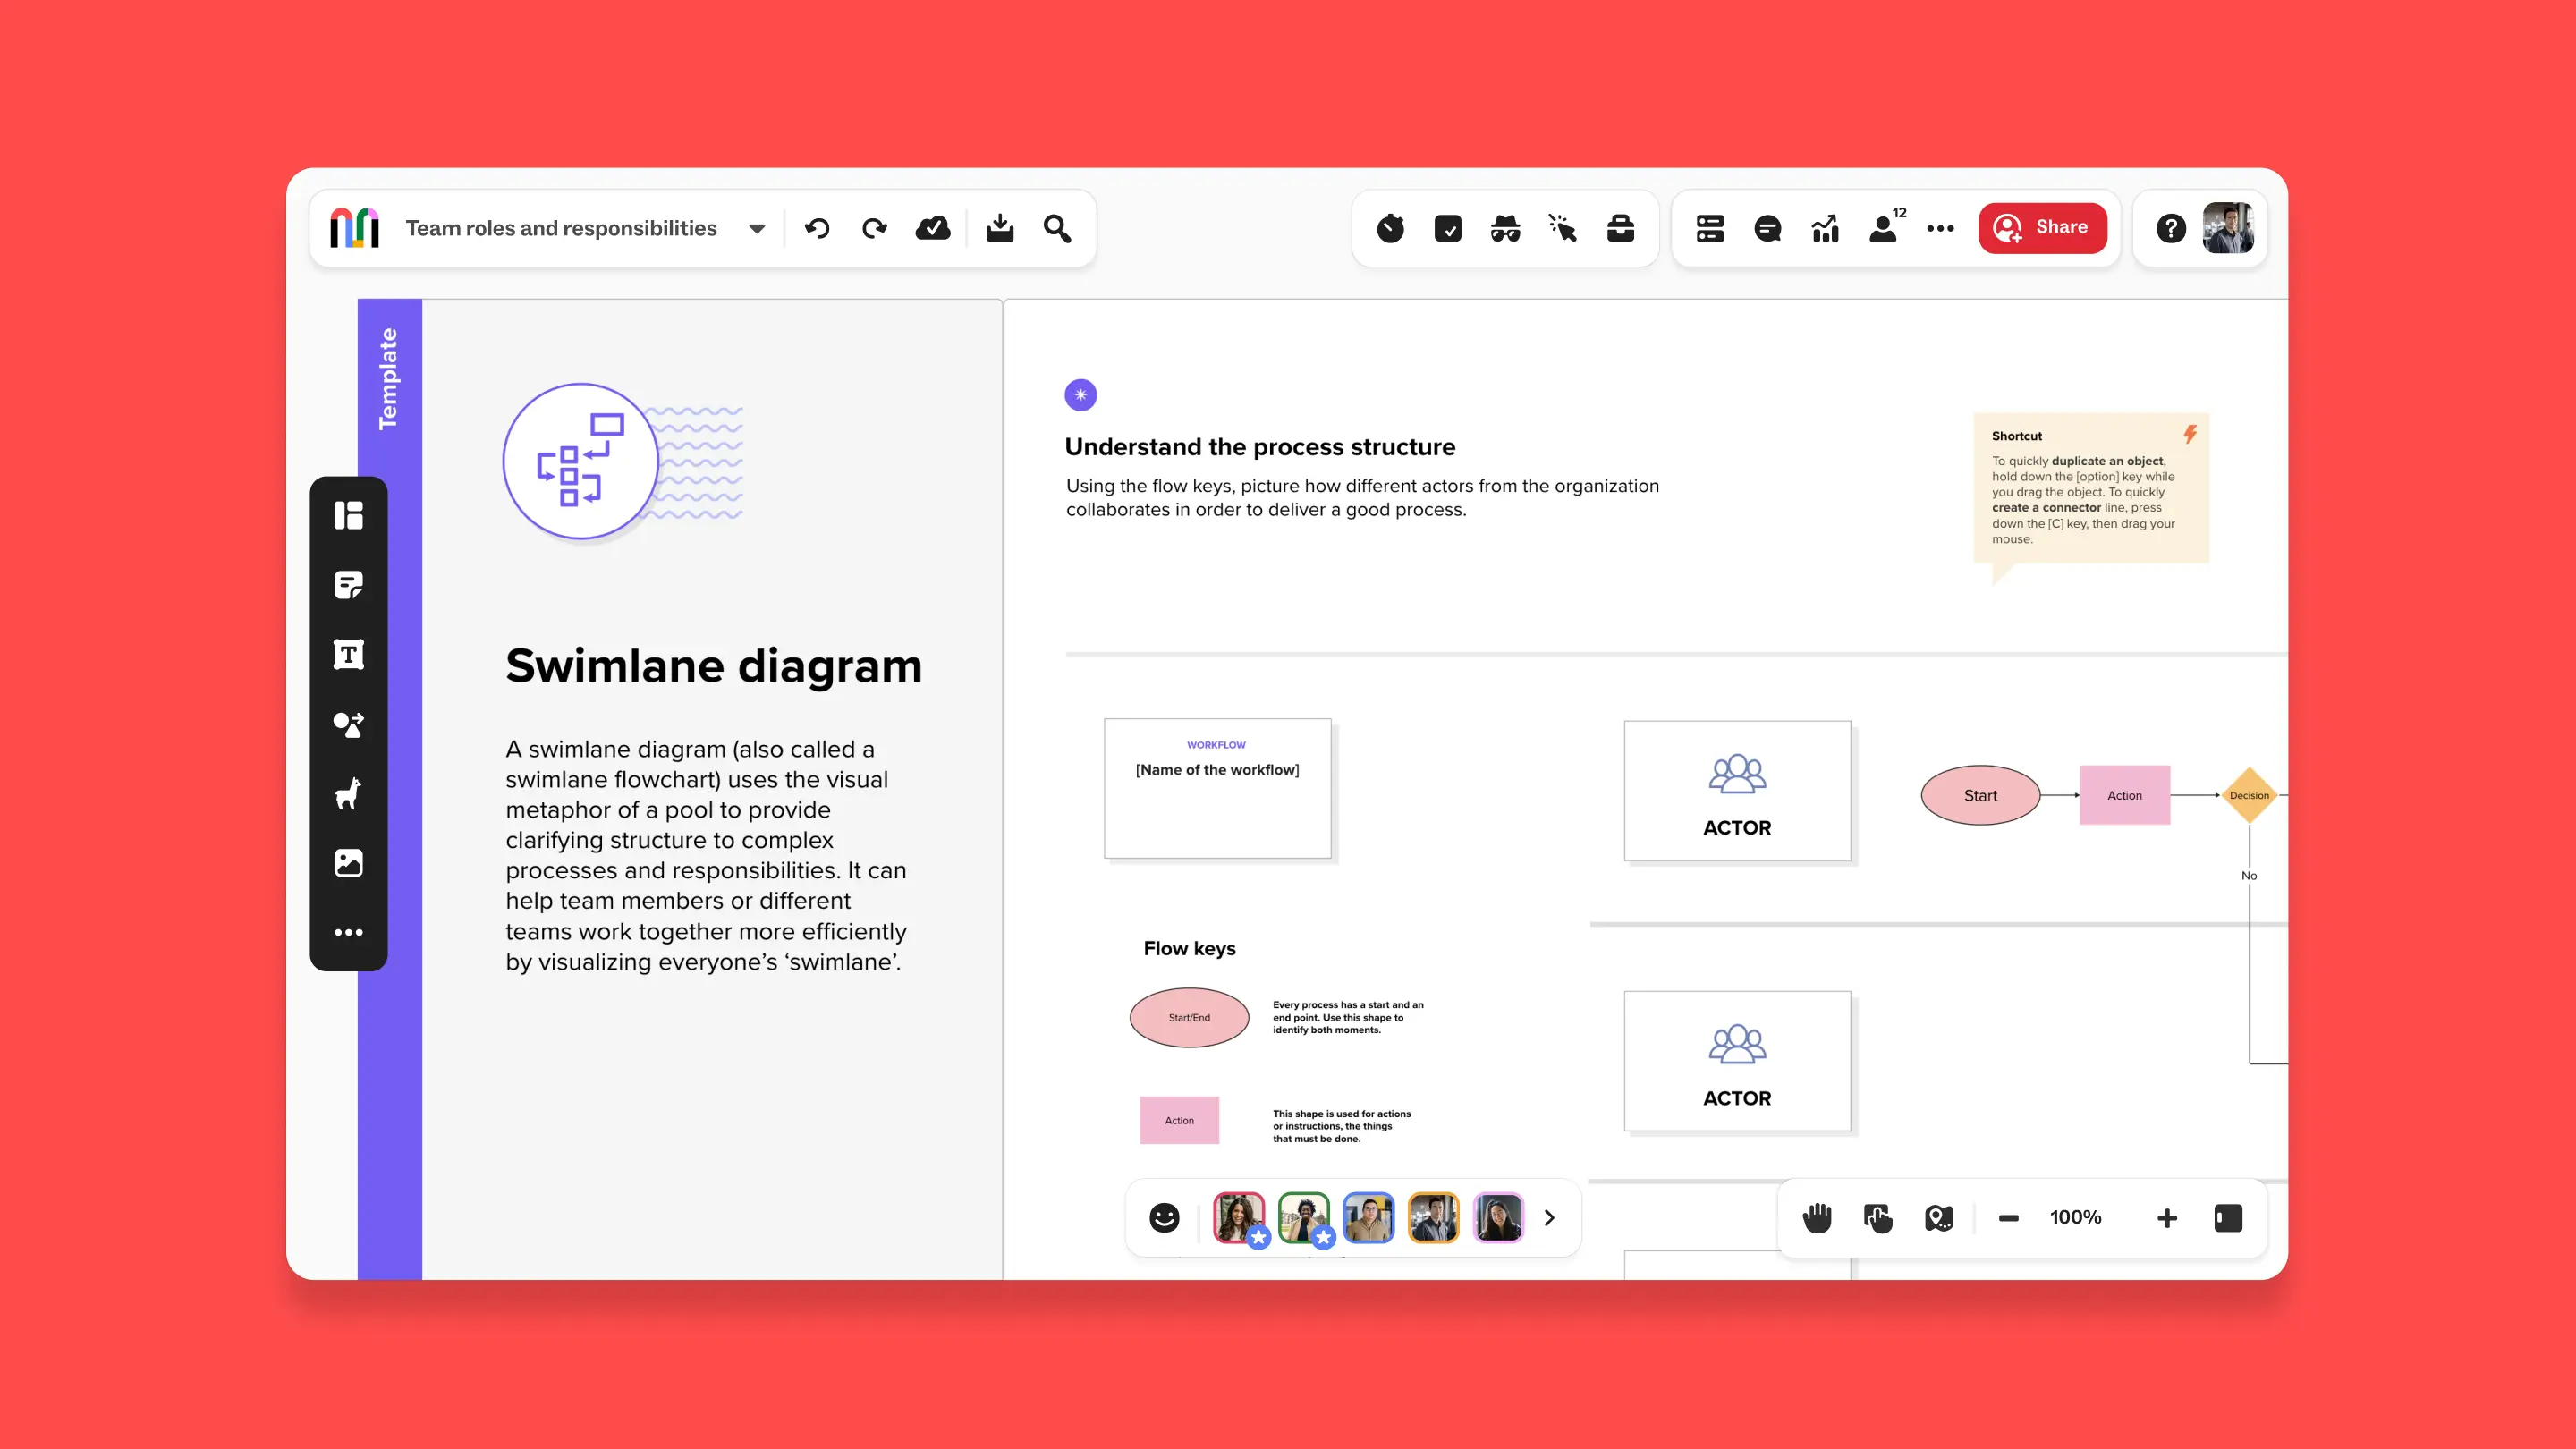
4. Swimlane Flowchart template
Use a swimlane flowchart, or swimlane diagram, to visualize roles and responsibilities for important projects so that no one feels underwater.
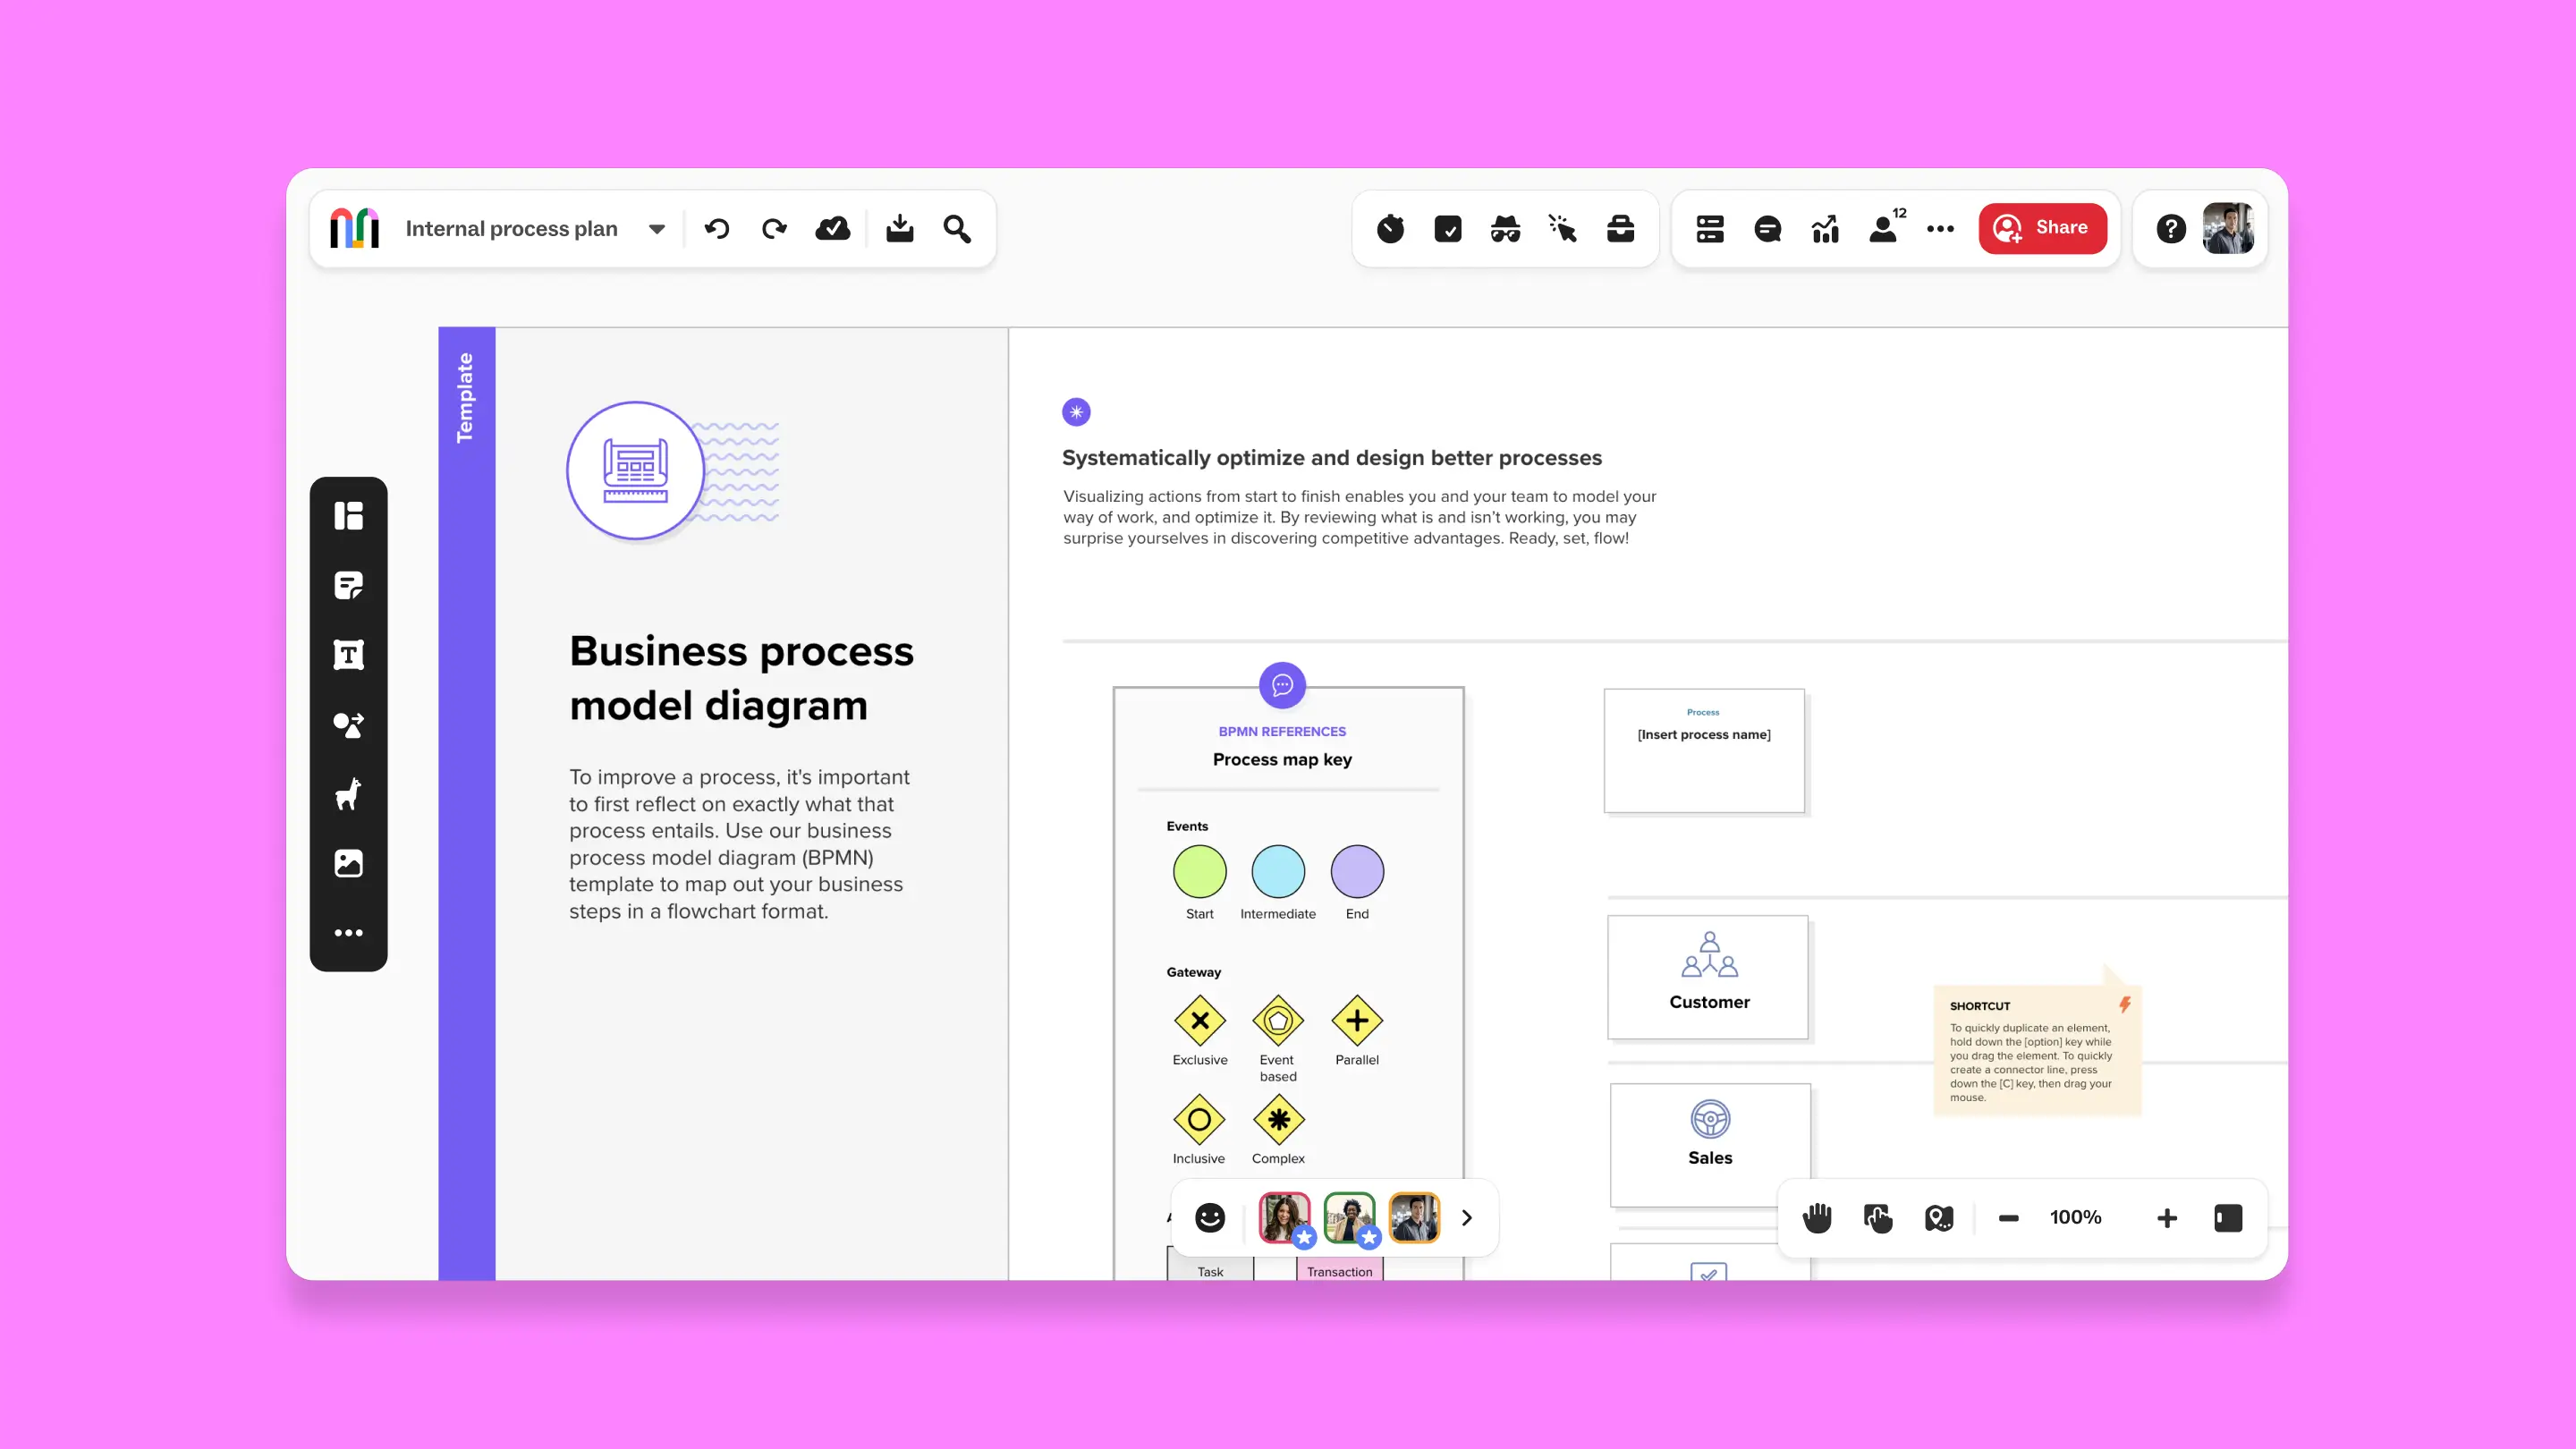
5. Business Process Modeling Diagram (BPMN) template
Diagram step-by-step actions and inputs in a business process with this robust BPMN diagram example.
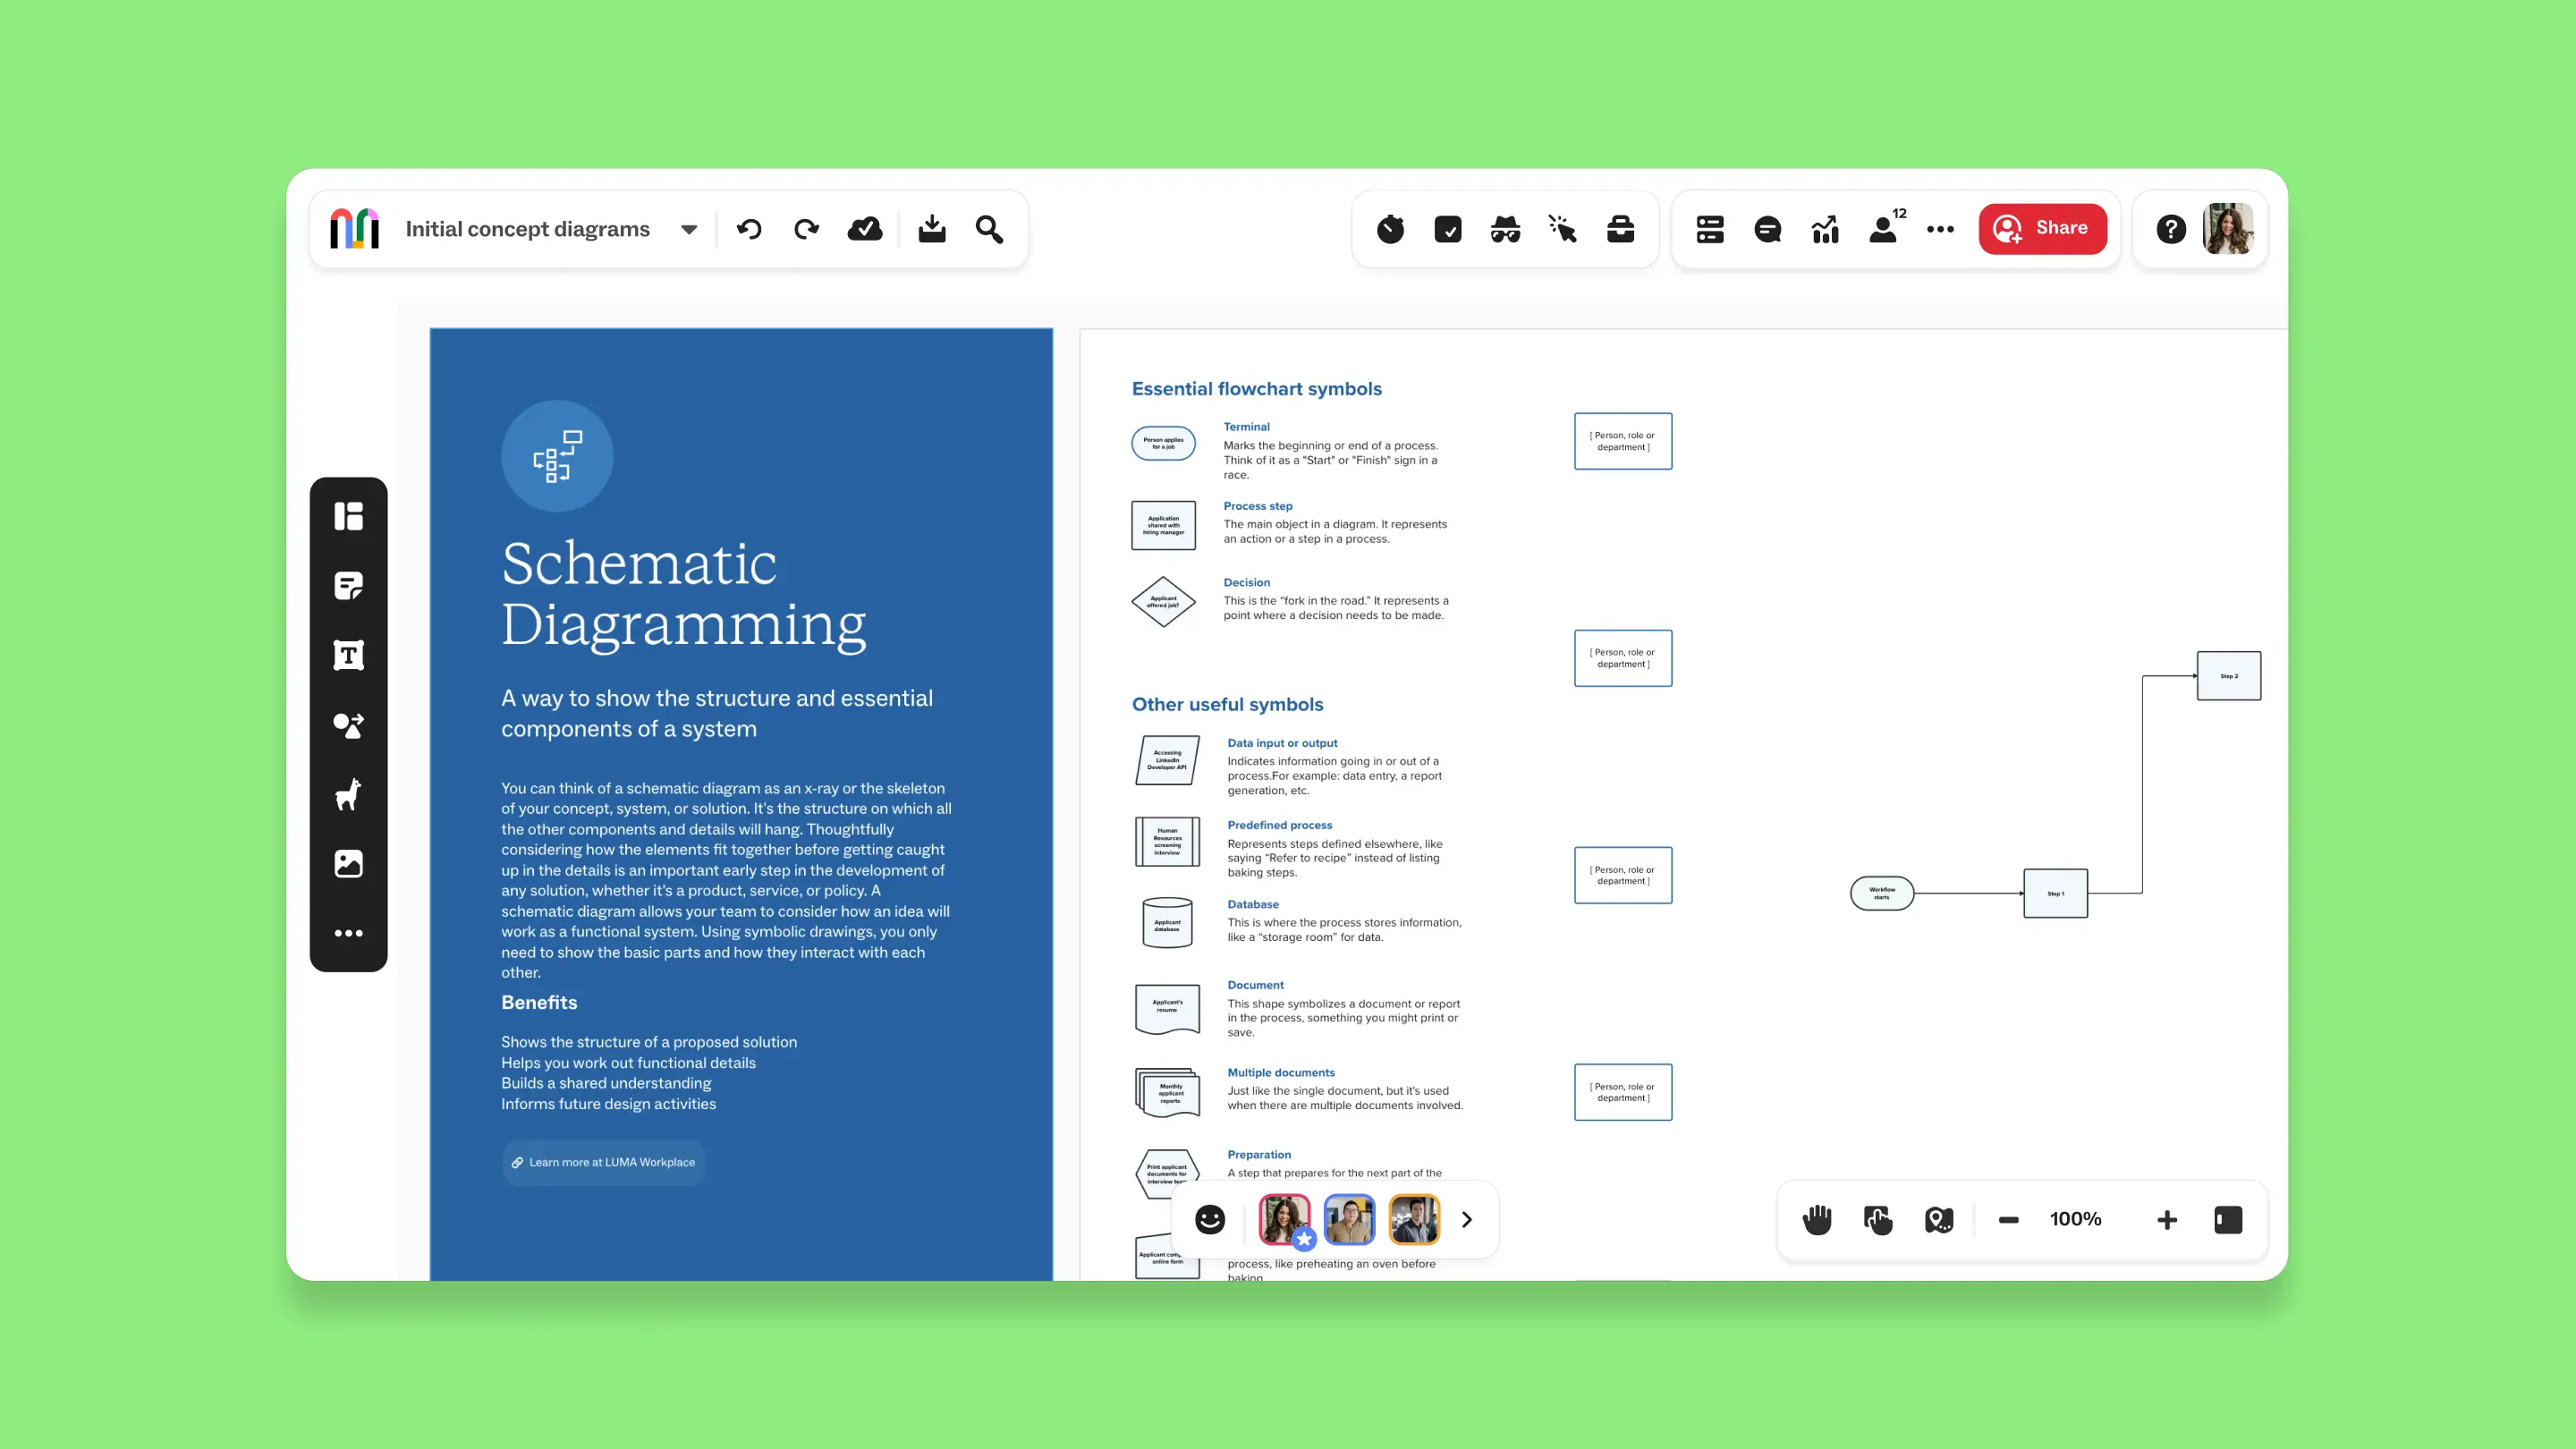
6. Schematic Diagramming template
A schematic diagram is best used when you need to show the parts of a system or circuit clearly and simply. It shows how the parts connect and work together without showing how they are laid out in a physical way.
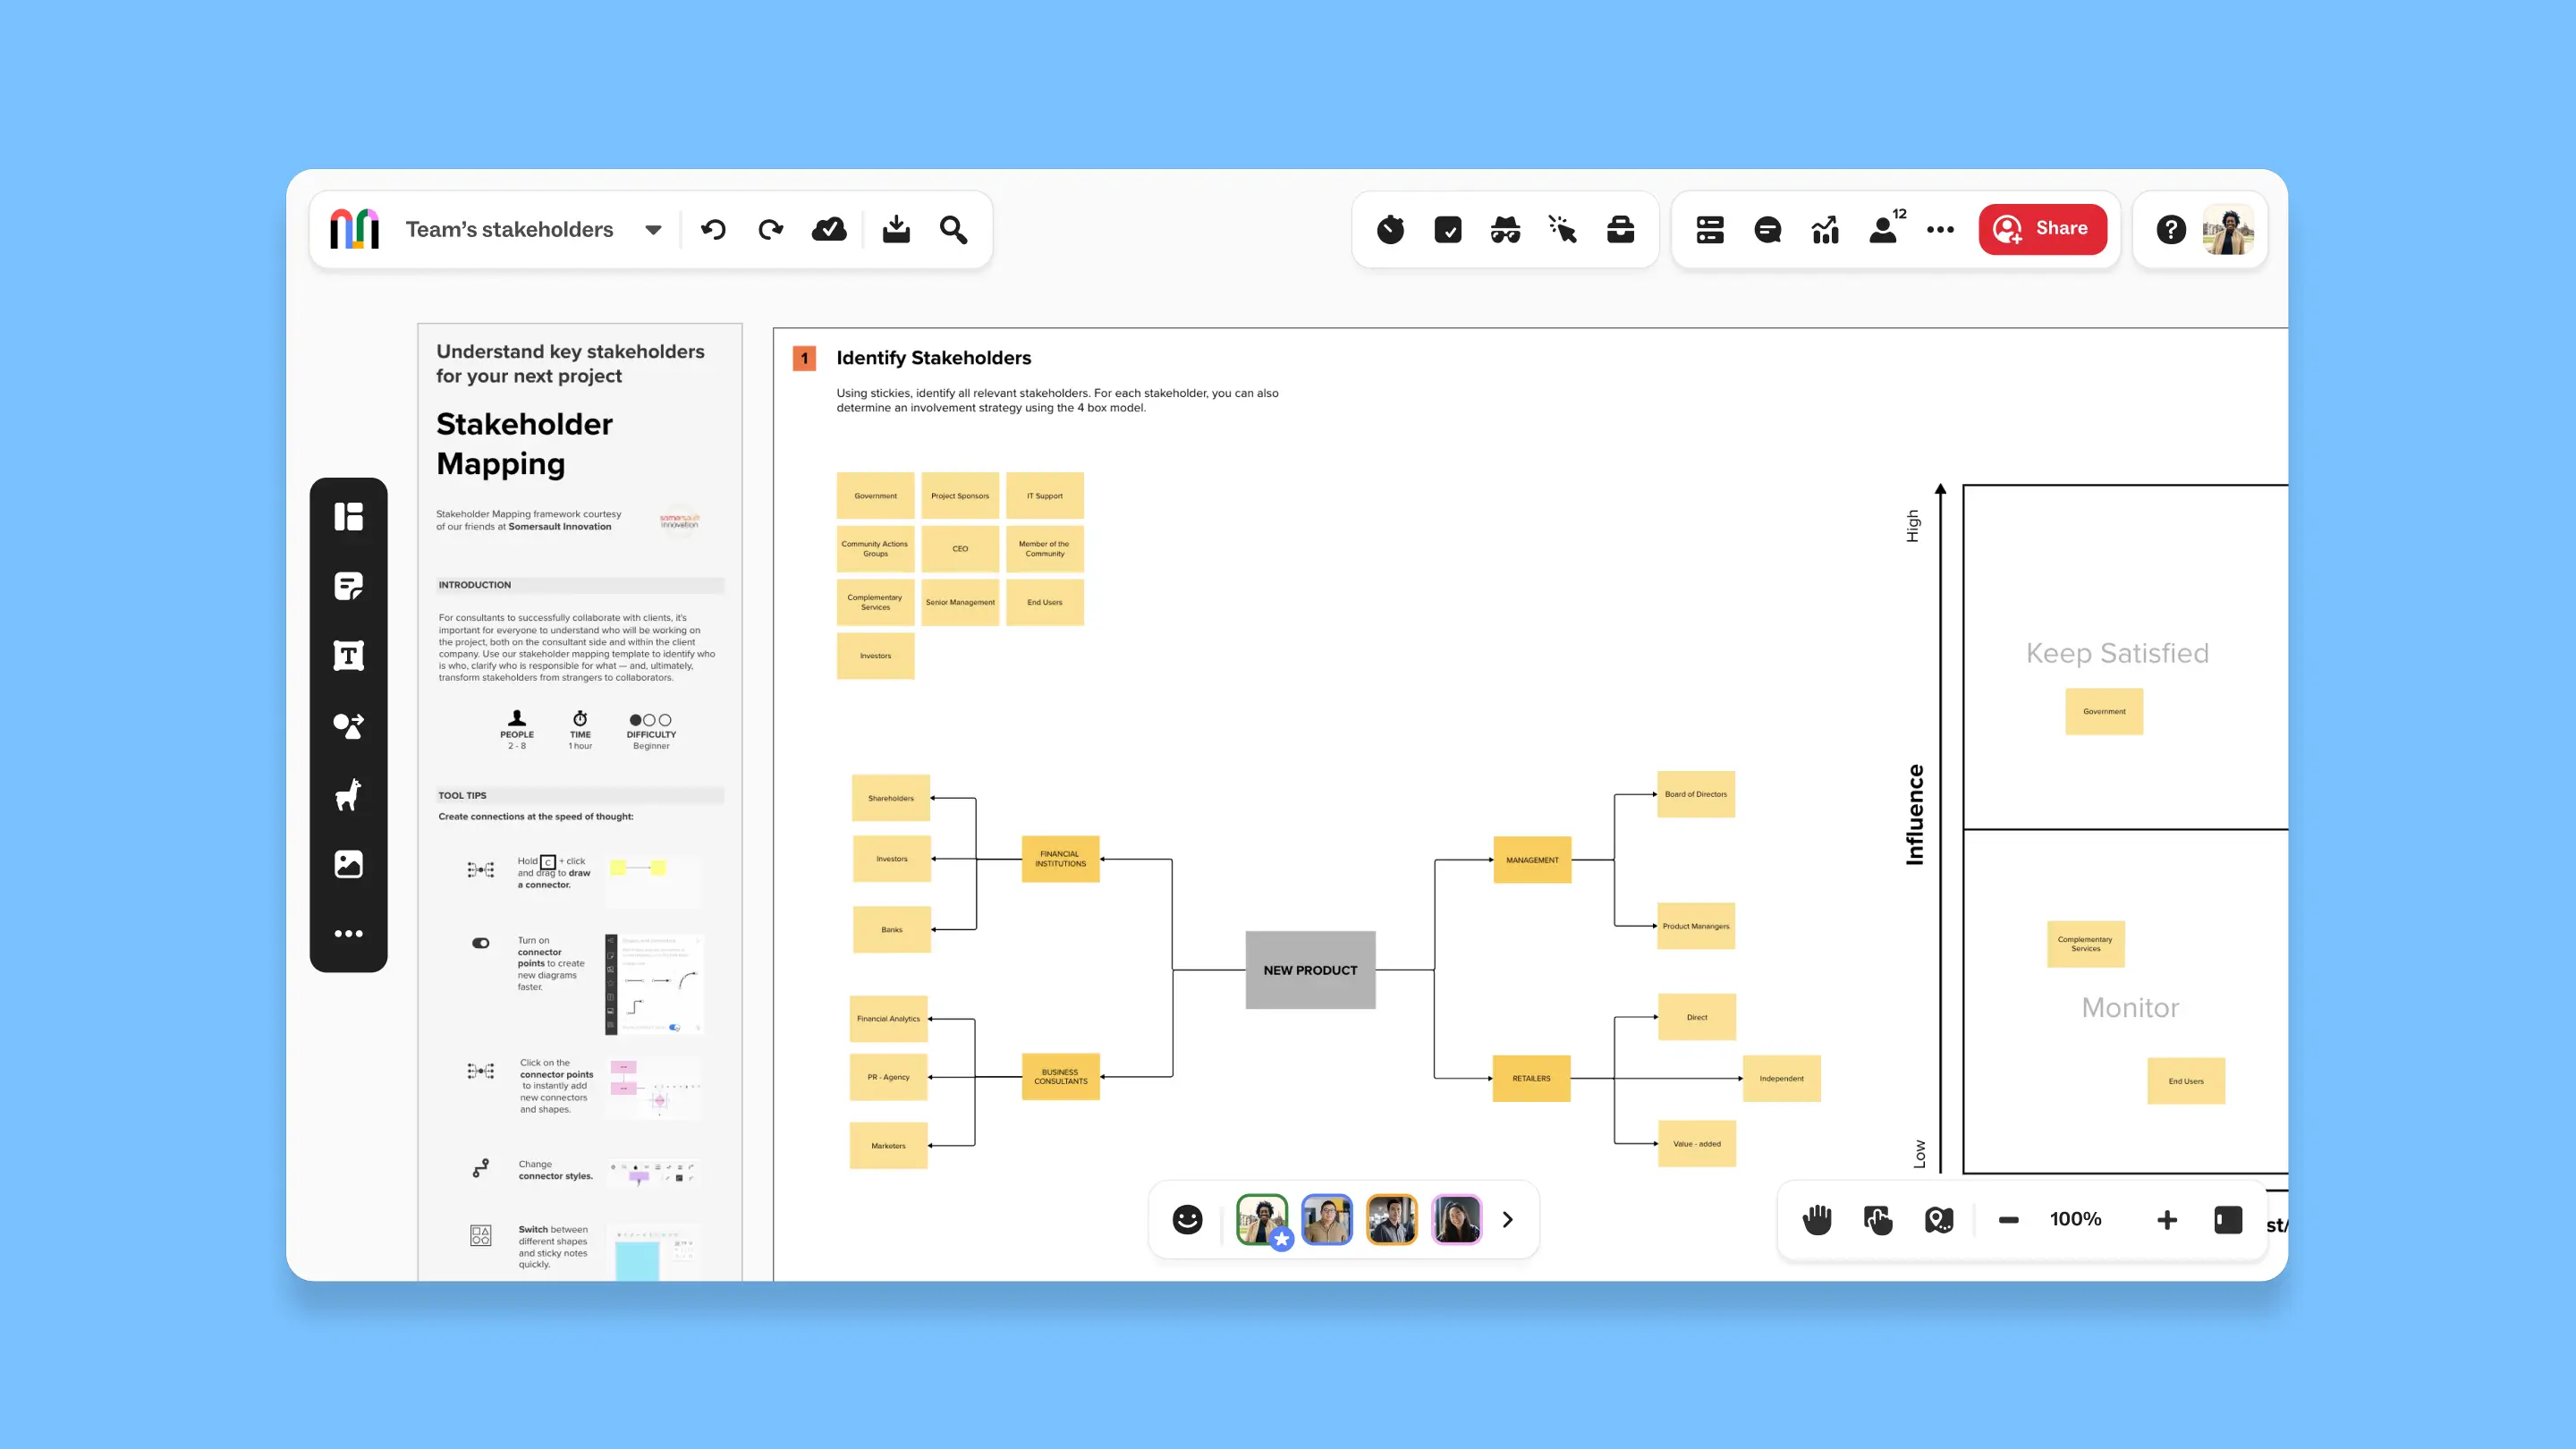
7. Stakeholder Mapping template
A stakeholder map diagram is used to visually organize and analyze the relationships, influence, and interests of stakeholders in a project, helping to strategize communication and engagement throughout the project lifecycle.
When to use a flowchart
Flowcharts are versatile tools that can be used in various scenarios to organize information, clarify processes, and identify inefficiencies. Here’s a more detailed look at some common use cases for flowcharts and examples of flow diagrams in action:
- Documenting a process: When new employees join a company or when a team is updating its procedures, a flowchart can serve as a visual reference that outlines each step in a business process. This helps ensure everyone understands the workflow and their roles within it.
- Identifying potential breakdowns and bottlenecks in a process: Flowcharts can highlight areas where processes slow down or where errors frequently occur. This visualization helps managers and team members anticipate problems and implement preventive measures before issues become more severe.
- Visualizing dependencies in a process: In complex projects, understanding how different tasks are interconnected can help in planning and resource allocation. A flowchart can show the sequence of actions and dependencies, ensuring that prerequisites are completed before subsequent steps begin.
- Automating a manual process: By mapping out the steps of a manual process, a flowchart can help identify which parts can be automated. This is particularly useful in reducing repetitive tasks and improving efficiency in operations.
- Visualizing the flow of data: In IT and data management, flowcharts are essential for illustrating how data moves through systems. This can be crucial for troubleshooting issues, enhancing systems, or complying with data protection regulations.
- Planning a project: Project managers use flowcharts to outline the phases of a project and the critical milestones. This helps in communicating the project plan to team members and stakeholders, ensuring a clear understanding of project timelines and deliverables.
- Identifying the right person to own a task or project: A flowchart can help clarify roles and responsibilities within a team by mapping who's responsible for each step in a process. This is particularly useful in complex projects where multiple teams or departments are involved.
- Troubleshooting technical issues: In technical support and engineering, flowcharts are used to diagnose problems and determine solutions. By following the paths laid out in a flowchart, technicians can systematically identify the source of a problem and the steps needed to resolve it.
- Making a decision that involves multiple variables: Decision-making flowcharts help in situations where choices depend on multiple factors. By following different branches based on varying conditions, decision-makers can see potential outcomes and make informed choices.
Collaborative diagramming made easy with Mural
Anyone can visualize diagrams, flows, processes, and more in Mural to generate great ideas, structure complex processes, and optimize user experiences. Our platform simplifies the entire flowchart creation process for your team. Work at the speed of thought alongside teammates, clients, or customers to achieve your collaborative goals.
Sign up for a Free, Forever account today and see how flowcharts can enhance collaboration, improve your processes, and make communication more effective and efficient.